SYSTINVEST
  • Über
    • über Systinvest
    • Investmentphilosophie
  • Blog
  • Crash Weltkarte
  • Crash Protection
    • Letzter Stand
    • Philosophie
    • Crashphasen Charakteristika
    • Beispiele Marktrisiko
    • Backtests Crash Protection
  • wikifolios
    • Hebel +3faches Risikomanagement
    • Hebel Multistrategien
    • Marktzyklen offensiv gehebelt
    • Marktzyklen
    • Aktienwertselektion mit System
    • Alpha+Beta+Crash Risk Control
  • Ratgeber
    • Wie teuer sollte ein ETF oder Fonds sein?
    • Kann man mit Aktien reich werden?
    • Wie kann man sich vor Inflation schützen?
    • Crash am Aktienmarkt - Wieviel kann man verlieren?
    • Wie riskant sind Aktiensparpläne wirklich?
  • Tools
    • Sparplanrechner
    • Annuitätenrechner
  • Legenden
    • Warren Buffet
    • Edward O. Thorp
    • James Simons
    • "Pitbull" Marty Schwartz
    • Stanley Druckenmiller
  • Analysen
    • Altersvorsorge >
      • Inflation und Kaufkraftverlust
      • Inflationsschutz - Aktien oder Gold?
      • Generationen Altersvorsorge
      • Sparplanvergleich Aktien/Lebensversicherung >
        • Berechnungsannahmen
        • Ohne Steuerbetrachtung
        • Effekt Abgeltungssteuer
        • Effekt Inflation
    • Anlagestrategien >
      • Vola und Sharpe Ratio
      • Aktien mit Vola 2%
      • Momentum
    • Historische Vergleiche >
      • DAX 2016
      • DAX vs S&P 500
  • About
    • About systinvest
    • Investment philosophy
  • Blog
  • Crash World Map
  • Crash Protection
    • Latest Status
    • Philosophy
    • Crashperiod Characteristics
    • Examples Market Risk
    • Backtest Crash Protection
  • wikifolios
    • Leverage +3x Risk Management
    • Leverage Multistrategies
    • Marketcycles leveraged dynamically
    • Marketcycles
    • Systematic Stockpicking
    • Alpha + Beta + Crash Risk Control
  • Good to Know
    • How much should a fund cost?
    • Can you get rich with stocks?
    • How to protect against inflation?
    • Stock Market Crashs - How much can you lose?
    • Are stock saving plans really risky?
  • Tools
    • Savings Plan Calculator
    • Annuity Calculator
  • Analyses
    • Pension >
      • Inflation and Purchasing Power
      • Inflation protection - Stocks or Gold?
      • Cross-Generational Pension Plan
    • Investment Strategies >
      • Vola and Sharpe Ratio
      • Equity with 2% Vola
      • Momentum-en
    • Historical Backtests >
      • DAX 2016-en
      • S&P 500 vs DAX

Crash Protection

Examples Market Risk

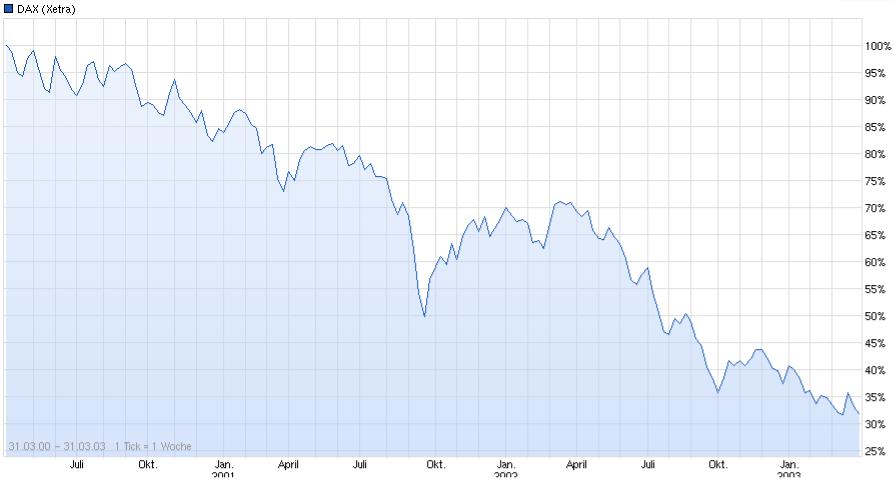
Example 1: DAX, April 2000 - April 2003

Bild
An investor, who entered the DAX in April 2000 would have lost 70% during a 3-year period until April 2003.
This loss would have been recovered until 2007 just to drop another 50% during the two years afterwards.

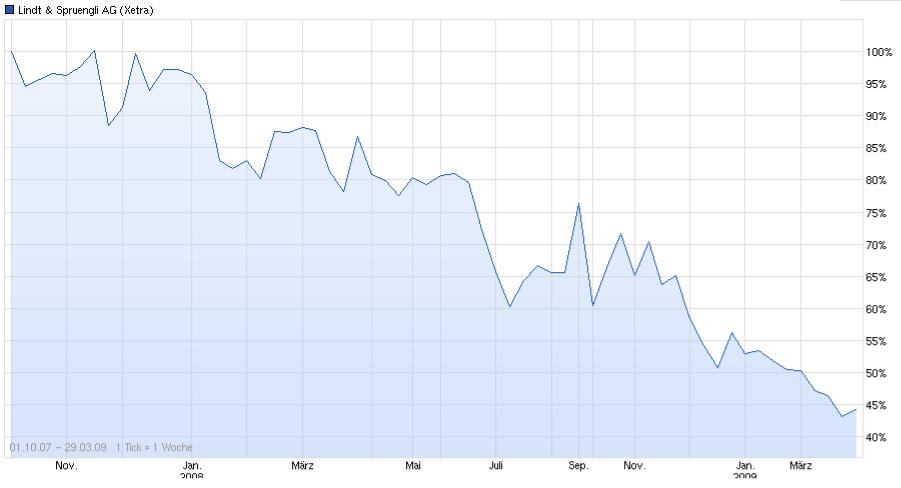
Example 2: Lindt & Spruengli, October 2007 - April 2009

Bild
A common way to pick stocks is to look for supposed secure stocks. One such stock is the one from Swiss chocolate producer Lindt&Spruengli. An investor has to be aware, that during periods of market distress presumed secure stocks will also suffer a lot, even if it might be less than the drawdown of a  general market index.
The stock of Lindt&Spruengli illustrates this issue, since it lost 55% during the financial crisis. Holding a secure stock will not protect an investor from high losses during a market crash.


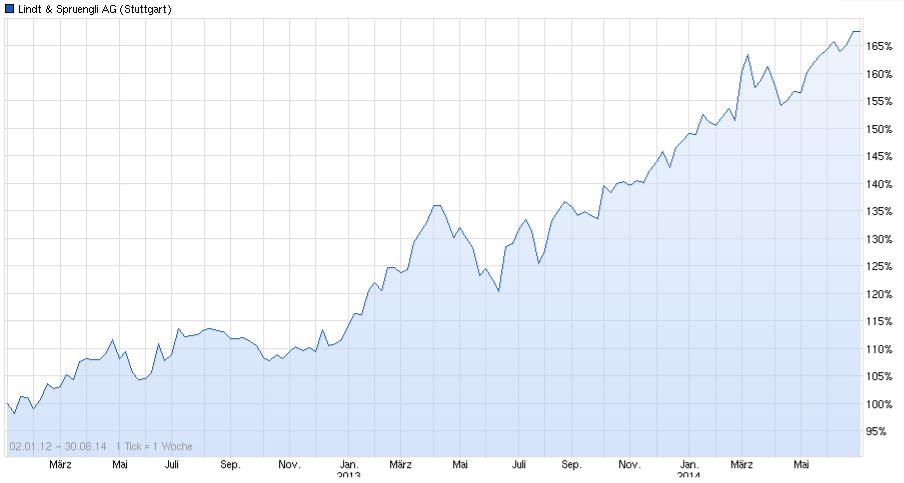
Example 3: DAX and Lindt & Spruengli, January 2012 - July 2014

Being aware of the high risks one equity investor might face could lead someone to avoid investments in the stock market at all. Consequence will be that such an investor will also miss the opportunities an equity investment provides. An equity investor who entered the DAX or Lindt&Spruengli in Januray 2012 would have made a profit of +65% until July 2014, which equals an annual return of +22%. Such a performance would hardly been achieved with other asset classes.

Bild
Bild

Impact of a capped Drawdown on Return

How would the annual return of an investment would be impacted by a drawdown controlling strategy which on the other side will miss some performance of the market recovery?
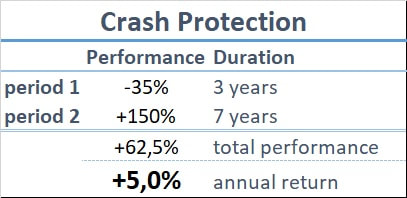
Bild
Bild
Conclusion
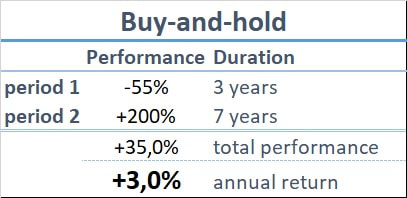
A risk-reducing strategy, which caps drawdowns during a crash from 55% to 35% could even underperform the following market recovery of 200% by 50% and will still outperform a simple buy-and-hold strategy significantly.


go to backtest results of crash Protection
Content
contact@systinvest.com
ÜBER
systinvest.com | Investmentphilosophie
BLOG
CRASH WELTKARTE
CRASH PROTECTION
Letzter Stand | Philosophie | Crashphasen Charakteristika | Beispiele Marktrisiko | Backtests
WIKIFOLIOS
RATGEBER
TOOLS
LEGENDEN
ANALYSEN
​​Altersvorsorge | Anlagestrategien | Historische Vergleiche
KRYPTO
DISCLAIMER
DATENSCHUTZERKLÄRUNG
IMPRESSUM
Content
ABOUT
systinvest.com | Investment Philosophy
BLOG
CRASH WORLD MAP
CRASH PROTECTION
Latest Status | Philosophy | Crashperiod Characteristics | Examples Market Risk | Backtests
WIKIFOLIOS
GOOD TO KNOW
TOOLS
ANALYSES
Pension | Investment Strategies |Historical Backtests
CRYPTO
DISCLAIMER
DATENSCHUTZERKLÄRUNG
IMPRESSUM
  • Über
    • über Systinvest
    • Investmentphilosophie
  • Blog
  • Crash Weltkarte
  • Crash Protection
    • Letzter Stand
    • Philosophie
    • Crashphasen Charakteristika
    • Beispiele Marktrisiko
    • Backtests Crash Protection
  • wikifolios
    • Hebel +3faches Risikomanagement
    • Hebel Multistrategien
    • Marktzyklen offensiv gehebelt
    • Marktzyklen
    • Aktienwertselektion mit System
    • Alpha+Beta+Crash Risk Control
  • Ratgeber
    • Wie teuer sollte ein ETF oder Fonds sein?
    • Kann man mit Aktien reich werden?
    • Wie kann man sich vor Inflation schützen?
    • Crash am Aktienmarkt - Wieviel kann man verlieren?
    • Wie riskant sind Aktiensparpläne wirklich?
  • Tools
    • Sparplanrechner
    • Annuitätenrechner
  • Legenden
    • Warren Buffet
    • Edward O. Thorp
    • James Simons
    • "Pitbull" Marty Schwartz
    • Stanley Druckenmiller
  • Analysen
    • Altersvorsorge >
      • Inflation und Kaufkraftverlust
      • Inflationsschutz - Aktien oder Gold?
      • Generationen Altersvorsorge
      • Sparplanvergleich Aktien/Lebensversicherung >
        • Berechnungsannahmen
        • Ohne Steuerbetrachtung
        • Effekt Abgeltungssteuer
        • Effekt Inflation
    • Anlagestrategien >
      • Vola und Sharpe Ratio
      • Aktien mit Vola 2%
      • Momentum
    • Historische Vergleiche >
      • DAX 2016
      • DAX vs S&P 500
  • About
    • About systinvest
    • Investment philosophy
  • Blog
  • Crash World Map
  • Crash Protection
    • Latest Status
    • Philosophy
    • Crashperiod Characteristics
    • Examples Market Risk
    • Backtest Crash Protection
  • wikifolios
    • Leverage +3x Risk Management
    • Leverage Multistrategies
    • Marketcycles leveraged dynamically
    • Marketcycles
    • Systematic Stockpicking
    • Alpha + Beta + Crash Risk Control
  • Good to Know
    • How much should a fund cost?
    • Can you get rich with stocks?
    • How to protect against inflation?
    • Stock Market Crashs - How much can you lose?
    • Are stock saving plans really risky?
  • Tools
    • Savings Plan Calculator
    • Annuity Calculator
  • Analyses
    • Pension >
      • Inflation and Purchasing Power
      • Inflation protection - Stocks or Gold?
      • Cross-Generational Pension Plan
    • Investment Strategies >
      • Vola and Sharpe Ratio
      • Equity with 2% Vola
      • Momentum-en
    • Historical Backtests >
      • DAX 2016-en
      • S&P 500 vs DAX