SYSTINVEST
  • Über
    • über Systinvest
    • Investmentphilosophie
  • Blog
  • Crash Weltkarte
  • Crash Protection
    • Letzter Stand
    • Philosophie
    • Crashphasen Charakteristika
    • Beispiele Marktrisiko
    • Backtests Crash Protection
  • wikifolios
    • Hebel +3faches Risikomanagement
    • Hebel Multistrategien
    • Marktzyklen offensiv gehebelt
    • Marktzyklen
    • Aktienwertselektion mit System
    • Alpha+Beta+Crash Risk Control
  • Iconomi
  • Ratgeber
    • Wie teuer sollte ein ETF oder Fonds sein?
    • Kann man mit Aktien reich werden?
    • Wie kann man sich vor Inflation schützen?
    • Crash am Aktienmarkt - Wieviel kann man verlieren?
    • Wie riskant sind Aktiensparpläne wirklich?
  • Tools
    • Sparplanrechner
    • Annuitätenrechner
  • Legenden
    • Warren Buffet
    • Edward O. Thorp
    • James Simons
    • "Pitbull" Marty Schwartz
    • Stanley Druckenmiller
  • Analysen
    • Altersvorsorge >
      • Inflation und Kaufkraftverlust
      • Inflationsschutz - Aktien oder Gold?
      • Generationen Altersvorsorge
      • Sparplanvergleich Aktien/Lebensversicherung >
        • Berechnungsannahmen
        • Ohne Steuerbetrachtung
        • Effekt Abgeltungssteuer
        • Effekt Inflation
    • Anlagestrategien >
      • Vola und Sharpe Ratio
      • Aktien mit Vola 2%
      • Momentum
    • Historische Vergleiche >
      • DAX 2016
      • DAX vs S&P 500
  • About
    • About systinvest
    • Investment philosophy
  • Blog
  • Crash World Map
  • Crash Protection
    • Latest Status
    • Philosophy
    • Crashperiod Characteristics
    • Examples Market Risk
    • Backtest Crash Protection
  • wikifolios
    • Leverage +3x Risk Management
    • Leverage Multistrategies
    • Marketcycles leveraged dynamically
    • Marketcycles
    • Systematic Stockpicking
    • Alpha + Beta + Crash Risk Control
  • Iconomi
  • Good to Know
    • How much should a fund cost?
    • Can you get rich with stocks?
    • How to protect against inflation?
    • Stock Market Crashs - How much can you lose?
    • Are stock saving plans really risky?
  • Tools
    • Savings Plan Calculator
    • Annuity Calculator
  • Analyses
    • Pension >
      • Inflation and Purchasing Power
      • Inflation protection - Stocks or Gold?
      • Cross-Generational Pension Plan
    • Investment Strategies >
      • Vola and Sharpe Ratio
      • Equity with 2% Vola
      • Momentum-en
    • Historical Backtests >
      • DAX 2016-en
      • S&P 500 vs DAX

Good to Know

Historic Stock Market Crashs - How often did the S&P 500 crash and how much did it lose?

How to define a stock market crash?
A stock market crash can be defined differently but all such events have one thing in common - losses.

In addition to the so-called flash crashes, in which losses often occur instantaneously within one day and are then typically corrected again, it is particularly the longer-term loss periods during which loss magnitudes of -40% to over -70% can be observed.
Picture
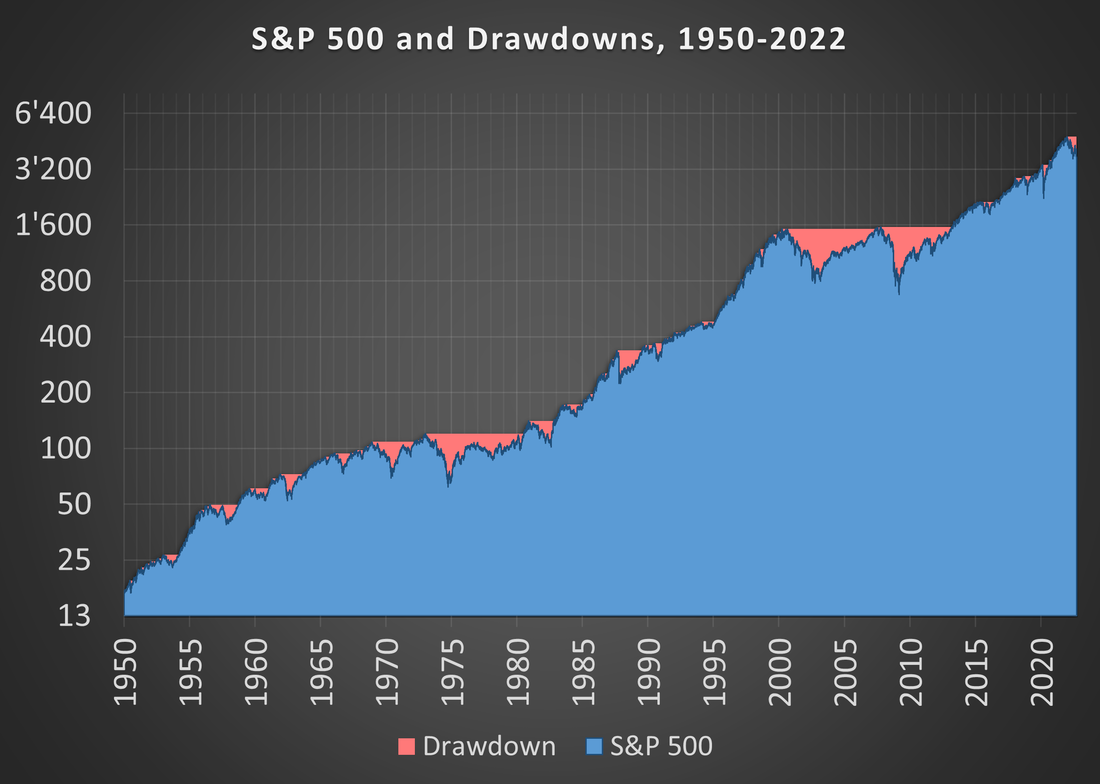
The chart of the S&P 500 from 1950 to 2022 shows, that periods of rising prices and crash periods alternate.

From 1950 to 1970 the S&P 500 gained continuously with smaller loss periods.

During the 1970s the S&P 500 moved sidewards with longer loss periods throughout the decade.

From 1980 to 2000 the S&P 500 had its strongst period with only few short-term loss periods with small loss magnitudes.

The decade from 2000 to 2010 showed two major loss periods and a non-trending S&P 500. Thereafter, the index again showed a very strong performance until recently.
How worse can it get during crash periods?
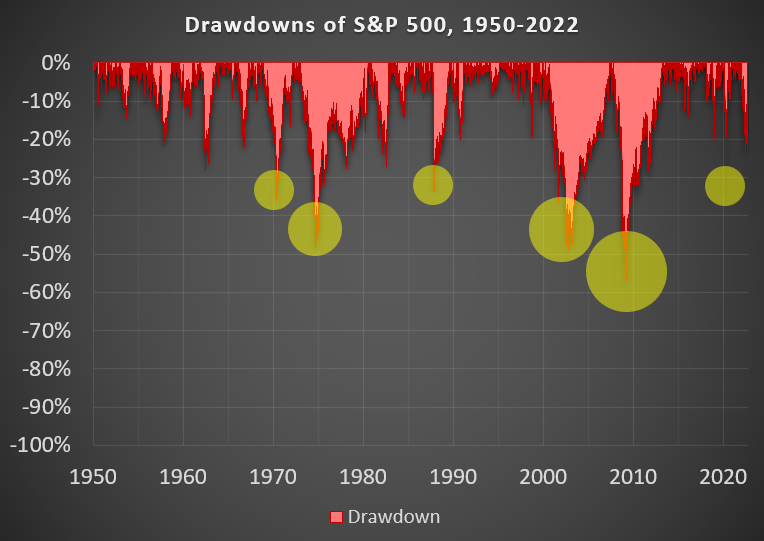
The following chart illustrates the severeness of the loss periods during which the S&P 500 accumulated losses.
Picture
This chart emphasizes the periods in which losses accumulated for almost -40% or more.

None in the 1950s
None in the 1960s
2x in the 1970s
1x in the 1980s
None in the 1990s
2x in the 2000s
None in the 2010s
1x in the 2020s

In total, 6 such periods have happened in the last 72 years, almost once every decade. Nevertheless, there have been long periods without any crash event while during others it happened more frequently.
Conclusion
A crash of -40% and more does not happen very often in the S&P 500, but on average it happens once in a decade.

The magnitude of the losses during these crash periods often reaches up to -40%. In more severe crashes like in 1974, 2003 or 2008, the losses accounted for even -50% to -60%.

Every stock market investor should be prepared for such crash events since they will very likely happen several times during a lifetime.
Content
contact@systinvest.com
ÜBER
systinvest.com | Investmentphilosophie
BLOG
CRASH WELTKARTE
CRASH PROTECTION
Letzter Stand | Philosophie | Crashphasen Charakteristika | Beispiele Marktrisiko | Backtests
WIKIFOLIOS
RATGEBER
TOOLS
LEGENDEN
ANALYSEN
​​Altersvorsorge | Anlagestrategien | Historische Vergleiche
KRYPTO
DISCLAIMER
DATENSCHUTZERKLÄRUNG
IMPRESSUM
Content
ABOUT
systinvest.com | Investment Philosophy
BLOG
CRASH WORLD MAP
CRASH PROTECTION
Latest Status | Philosophy | Crashperiod Characteristics | Examples Market Risk | Backtests
WIKIFOLIOS
GOOD TO KNOW
TOOLS
ANALYSES
Pension | Investment Strategies |Historical Backtests
CRYPTO
DISCLAIMER
DATENSCHUTZERKLÄRUNG
IMPRESSUM
  • Über
    • über Systinvest
    • Investmentphilosophie
  • Blog
  • Crash Weltkarte
  • Crash Protection
    • Letzter Stand
    • Philosophie
    • Crashphasen Charakteristika
    • Beispiele Marktrisiko
    • Backtests Crash Protection
  • wikifolios
    • Hebel +3faches Risikomanagement
    • Hebel Multistrategien
    • Marktzyklen offensiv gehebelt
    • Marktzyklen
    • Aktienwertselektion mit System
    • Alpha+Beta+Crash Risk Control
  • Iconomi
  • Ratgeber
    • Wie teuer sollte ein ETF oder Fonds sein?
    • Kann man mit Aktien reich werden?
    • Wie kann man sich vor Inflation schützen?
    • Crash am Aktienmarkt - Wieviel kann man verlieren?
    • Wie riskant sind Aktiensparpläne wirklich?
  • Tools
    • Sparplanrechner
    • Annuitätenrechner
  • Legenden
    • Warren Buffet
    • Edward O. Thorp
    • James Simons
    • "Pitbull" Marty Schwartz
    • Stanley Druckenmiller
  • Analysen
    • Altersvorsorge >
      • Inflation und Kaufkraftverlust
      • Inflationsschutz - Aktien oder Gold?
      • Generationen Altersvorsorge
      • Sparplanvergleich Aktien/Lebensversicherung >
        • Berechnungsannahmen
        • Ohne Steuerbetrachtung
        • Effekt Abgeltungssteuer
        • Effekt Inflation
    • Anlagestrategien >
      • Vola und Sharpe Ratio
      • Aktien mit Vola 2%
      • Momentum
    • Historische Vergleiche >
      • DAX 2016
      • DAX vs S&P 500
  • About
    • About systinvest
    • Investment philosophy
  • Blog
  • Crash World Map
  • Crash Protection
    • Latest Status
    • Philosophy
    • Crashperiod Characteristics
    • Examples Market Risk
    • Backtest Crash Protection
  • wikifolios
    • Leverage +3x Risk Management
    • Leverage Multistrategies
    • Marketcycles leveraged dynamically
    • Marketcycles
    • Systematic Stockpicking
    • Alpha + Beta + Crash Risk Control
  • Iconomi
  • Good to Know
    • How much should a fund cost?
    • Can you get rich with stocks?
    • How to protect against inflation?
    • Stock Market Crashs - How much can you lose?
    • Are stock saving plans really risky?
  • Tools
    • Savings Plan Calculator
    • Annuity Calculator
  • Analyses
    • Pension >
      • Inflation and Purchasing Power
      • Inflation protection - Stocks or Gold?
      • Cross-Generational Pension Plan
    • Investment Strategies >
      • Vola and Sharpe Ratio
      • Equity with 2% Vola
      • Momentum-en
    • Historical Backtests >
      • DAX 2016-en
      • S&P 500 vs DAX