
How much should a fund cost?
The costs of an ETF or mutual fund are a decisive factor for rapid wealth accumulation. The most important costs are the ongoing management fees, which range from fees of less than 0.20% per year for passive products to over 1.50% for active funds.
This difference of 1.30% sounds harmless, but it can reach over $4,000 and more for savings plans with a term of 15 years. With terms of 30 years, the higher management fee can even result in unbelievable extra costs of over $50,000.
This difference of 1.30% sounds harmless, but it can reach over $4,000 and more for savings plans with a term of 15 years. With terms of 30 years, the higher management fee can even result in unbelievable extra costs of over $50,000.
The following charts show the results of various savings plans with monthly $100 (Euros) over periods of 15 and 30 years in the American S&P 500 Index, the German DAX, the Japanese Nikkei Index and the shares of Warren Buffett's company Berkshire Hathaway. The Japanese Nikkei is considered a favourable example of a negative stock market which started in 1990 and is often used as an argument to keep one's hands off the supposedly risky stock markets. We will see below whether and how much one would really have lost with a savings plan on the Japanese index.
Wealth and cost differences in 15-year DAX savings plans with 100€ a month
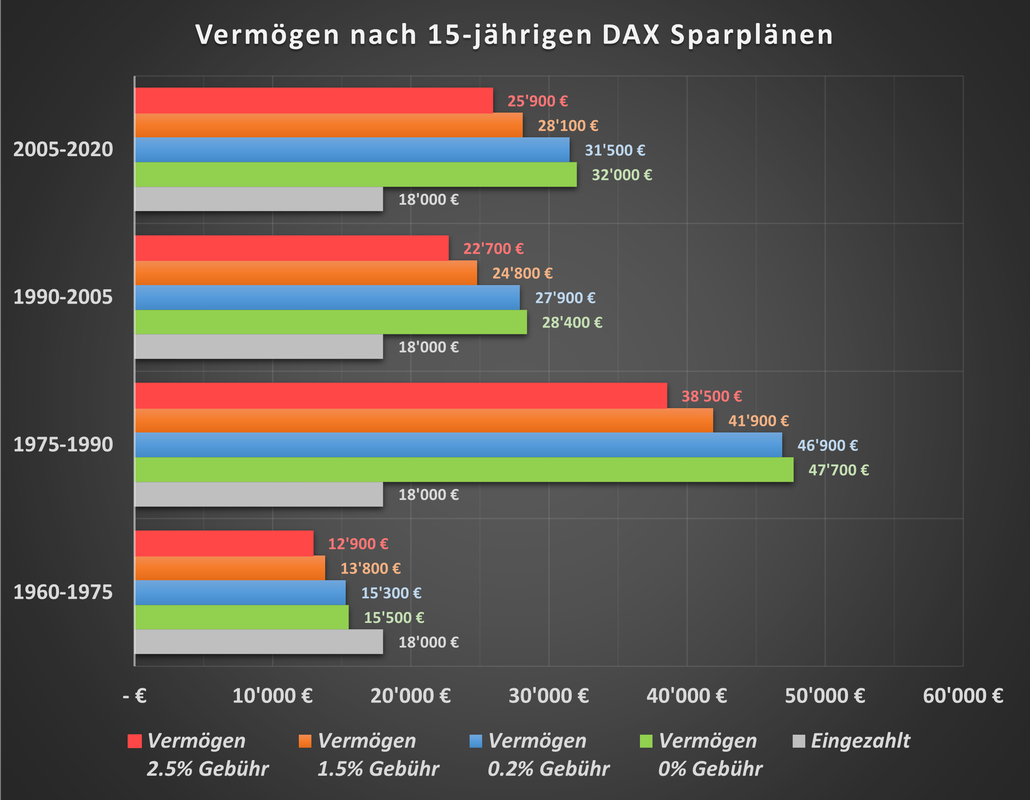
Chart 1 – DAX savings plan with 100€ a month over 15-year periods between 1960 and 2020.
|
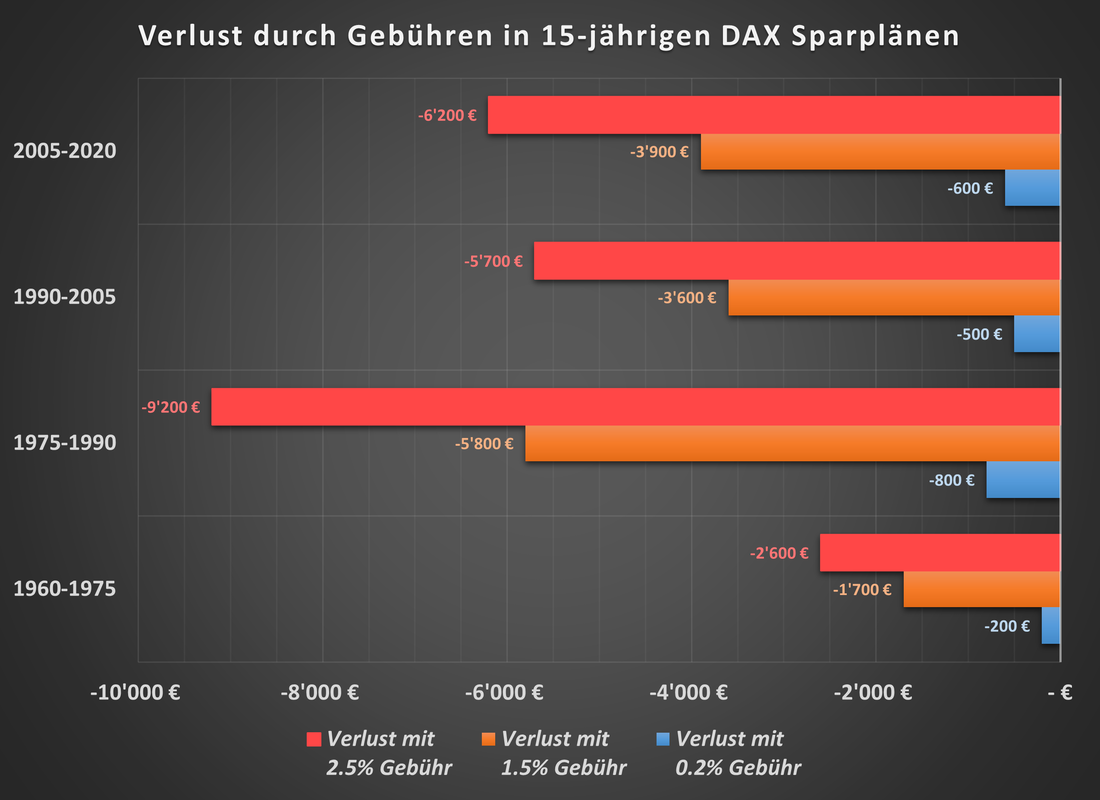
Chart 2 – Fee-related losses in 15-year $100-per-month DAX savings plans between 1960 and 2020.
|
Chart 1 shows that the $18,000 cumulatively deposited over 15 years would have always resulted in a profit except for the period 1960-1975.
Without fees, assets would have been from $15,500 (1975) to around $30,200 (2005 and 2020) to just under $47,700 (1990).
A savings plan into a product with 0.20% annual fees would not have deviated greatly from the cost-free results. $15,300 (1960) up to $46,900 (1990) and an average of $29,700 would have been available when the savings plans expired.
Now let’s have a look at the product with 1.50% annual fees. Here the wealth is a few thousand dollars lower. From $13,800 (1960) to $41,900 (1990) with an average of $26,500 (2005 and 2020).
Particularly expensive products with 2.50% annual fees have an even more dramatic effect. Only $12,900 (1960) at a minimum, $38,500 (1990) at best and an average of $24,300 (2005 and 2020).
Wealth and cost differences in 30-year DAX savings plans with 100€ a month
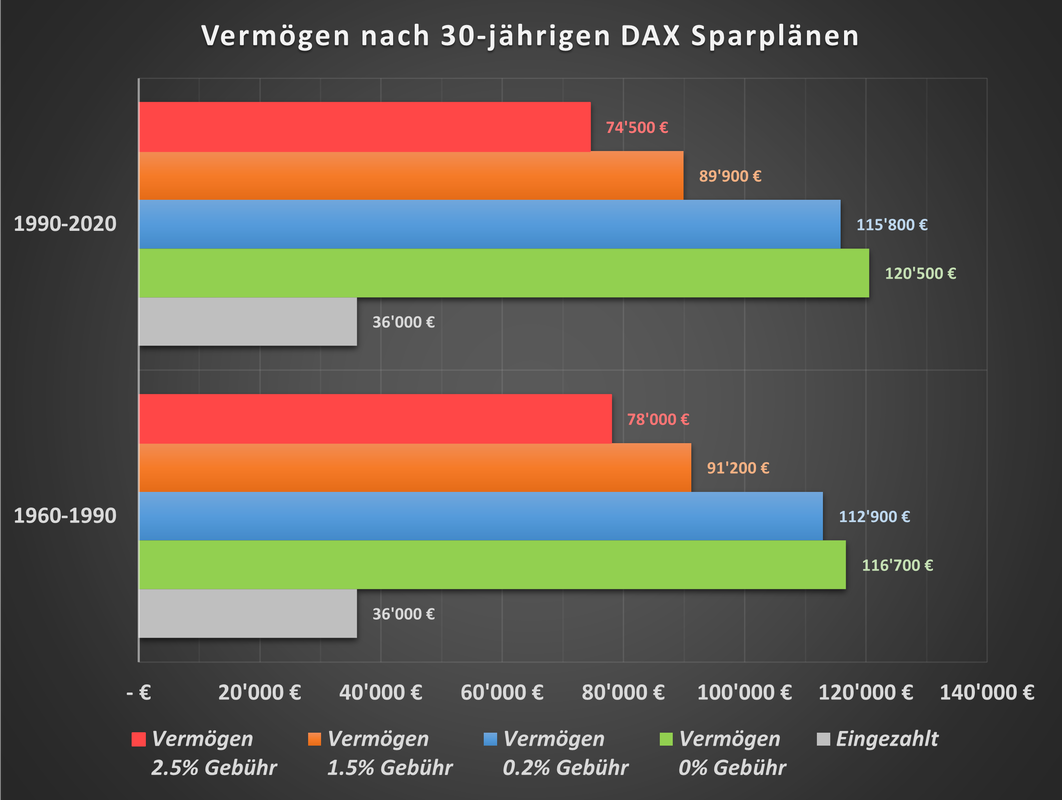
Chart 3 – DAX savings plan with $100 a month over 30-year periods between 1960 and 2020.
|
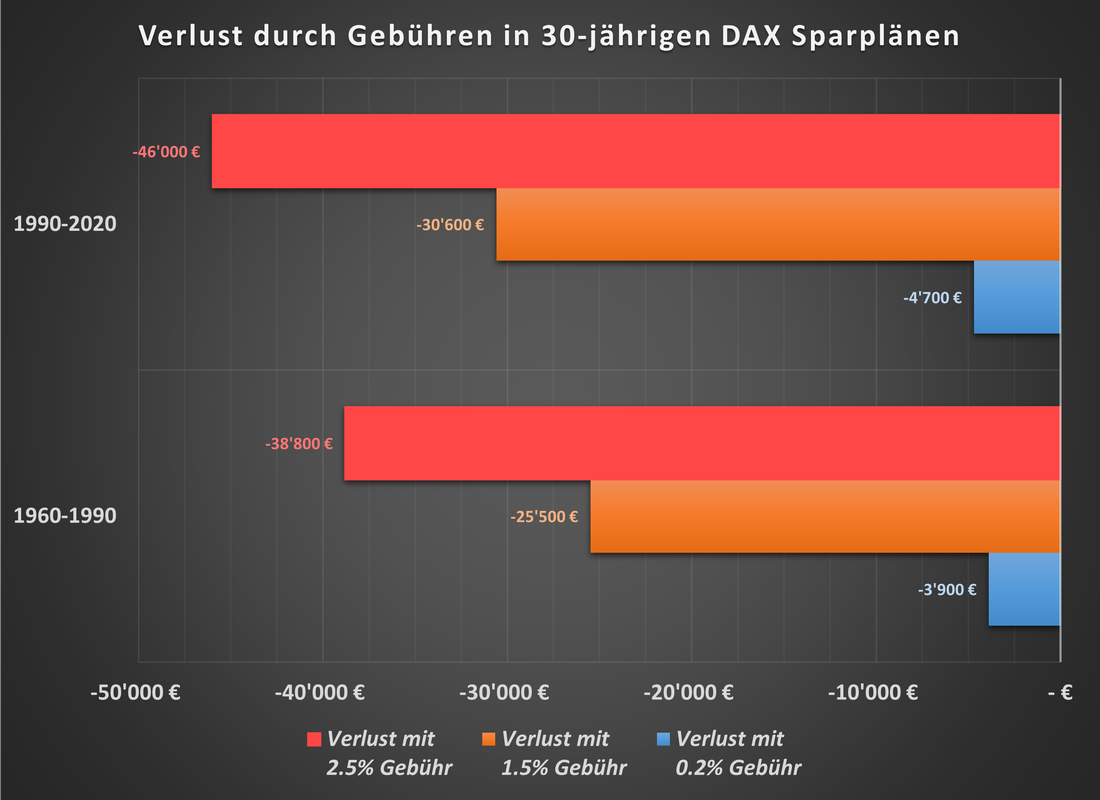
Chart 4 - Fee-related losses in 30-year $100-per-month DAX savings plans between 1960 and 2020.
|
Chart 3 shows that the $36,000 deposited over 30 years would have resulted in significant wealth growth in both the 1960-1990 and 1990-2020 periods.
Without fees, assets of $116,700 (1990) and $120,500 (2020) would have been created.
A savings plan into a product with 0.20% annual fees would not have deviated greatly from the free results. $112,900 (1990) and $115,800 (2020) would have been available when the savings plans expired. A cost impact of about $4000 to $5000.
The product with 1.50% in annual fees caused costs of $25,000 to $30,000 dollars (Chart 4). The wealth here only ranges from $91,200 (1990) to $89,900 (2020). A customer would certainly have been happy about the profits without even having noticed how much of his gains were reduced by the fees.
Particularly expensive products with 2.50% annual fees have an even more dramatic effect. Only $78,000 (1990) and $74,500 (2020) would have remained for the customer in terms of assets. In his joy, he would not have even noticed that he had to give up almost half of his profits with fees of $39,000 to $46,000 (Chart 4).
Wealth and cost differences in 15-year S&P 500 savings plans with $100 a month
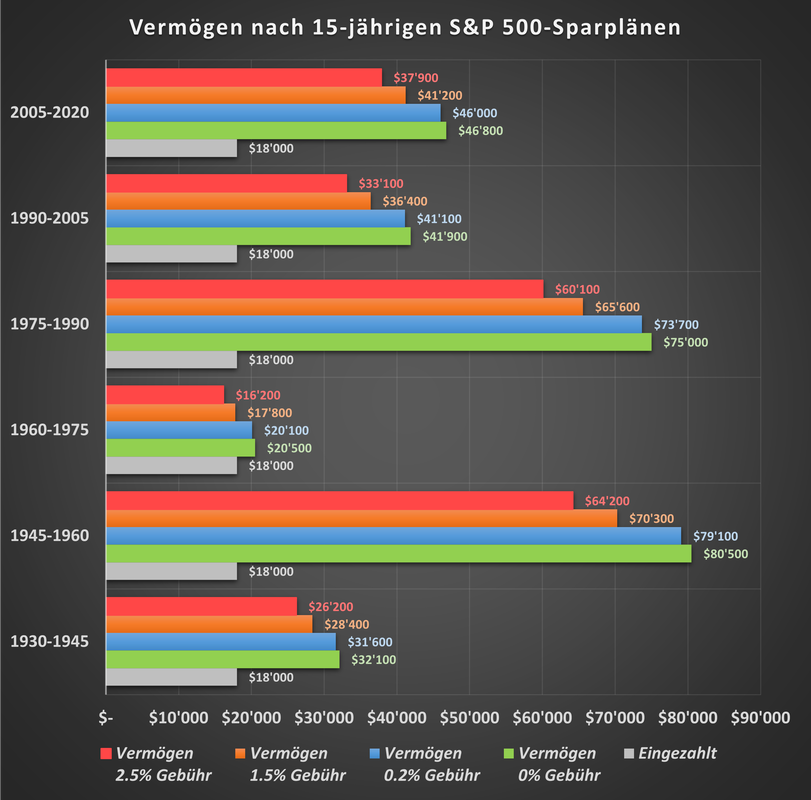
Chart 5 - S&P $100 monthly savings plan for 15-year periods between 1930 and 2020.
|
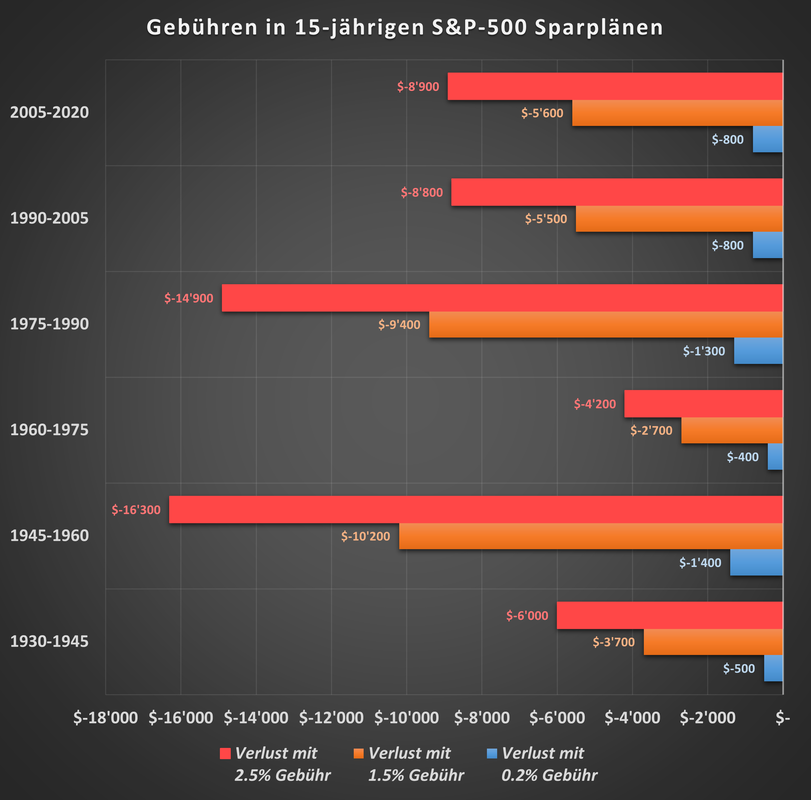
Chart 6 – Fee-related losses in 15-year, $100-per-month S&P 500 savings plans between 1930 and 2020.
|
Chart 5 shows that the $18,000 cumulatively deposited over 15 years in the periods 1930 to 2020 before expenses would always have resulted in a profit.
Without fees, fortunes of $20,500 (1975) to $80,500 (1960) with an average of $50,000 would have been created.
A savings plan into a product with 0.20% annual fees would not have deviated greatly from the cost-free results. From $20,100 (1975) to $79,100 (1960) and an average of $49,000 would have been available when the savings plans expired. Hence, the average cost was around $1000.
The product with 1.50% annual fees has an average cost of $6000 (Chart 6). The wealth here only ranges from $17,800 (1975) to $70,100 (1975), on average around $43,000.
Particularly expensive products with 2.50% annual fees have an even more dramatic effect with an average cost of $10,000 (Chart 6). Only $16,200 (1975) to $64,200 (1960) would have remained for the customer in assets, on average $39,000.
Wealth and cost differences in 30-year S&P 500 savings plans with $100 a month
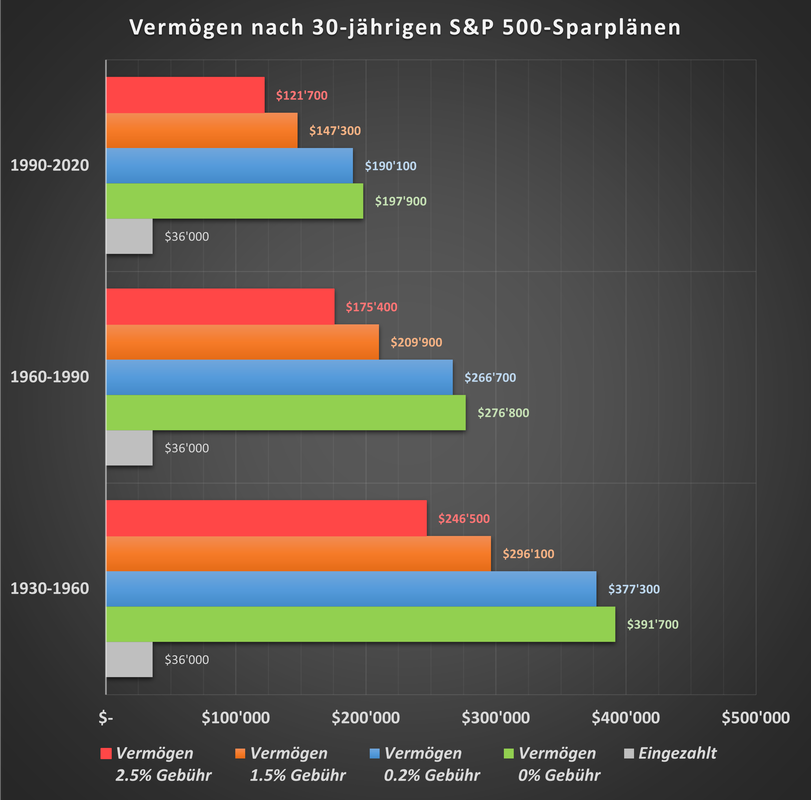
Chart 7 - S&P $100 monthly savings plan for 30-year periods between 1930 and 2020.
|
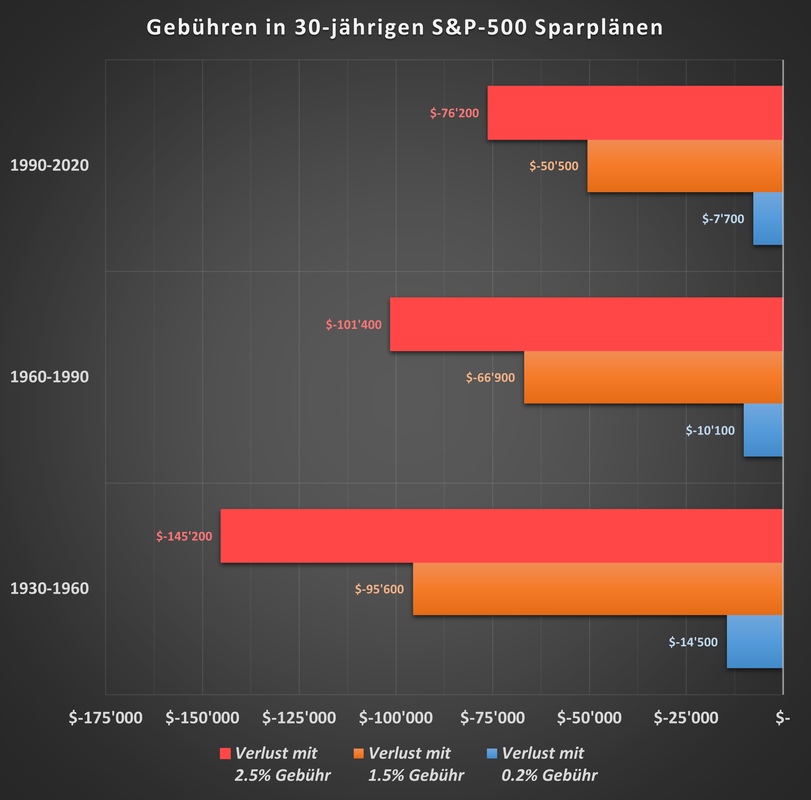
Chart 8 – Fee-related losses in 30-year, $100-month S&P 500 savings plans between 1930 and 2020.
|
Chart 7 shows that the total of $36,000 deposited over 30 years in the periods from 1930 to 2020 would always have resulted in a significant profit.
Without fees, assets of $197,900 (2020) over $276,800 (1990) to $391,700 (1960) would have been created.
A savings plan into a product with 0.20% annual fees would not have deviated greatly from the cost-free results. From $190,100 (2020) over $266,700 (1990) to $377,300 (1960) would have been available when the savings plans expired. The costs were therefore around $11,000.
The product with 1.50% annual fees caused an average cost of $70,000 (!) (Chart 8). The wealth here only ranges from $147,300 (2020) over $209,900 (1990) to $296,100 (1960).
Particularly expensive products with 2.50% annual fees have an even more dramatic effect with average costs of $110,000 (!!!) (Chart 8). Only $121,700 (2020) over $175,400 (1990) up to $246,500 (1960) would have remained for the customer in assets.
Wealth and cost differences in 15-year Nikkei savings plans with $100 a month
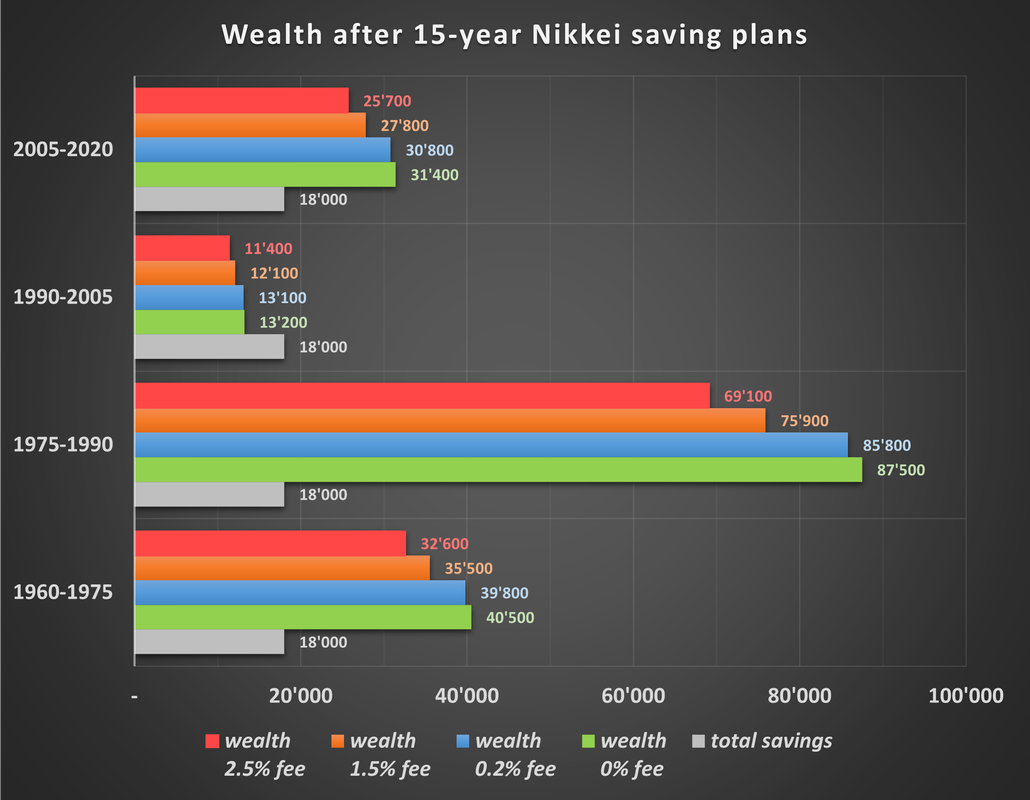
Chart 9 - Nikkei Savings Plan at $100 per month over 15-year periods between 1960 and 2020.
|
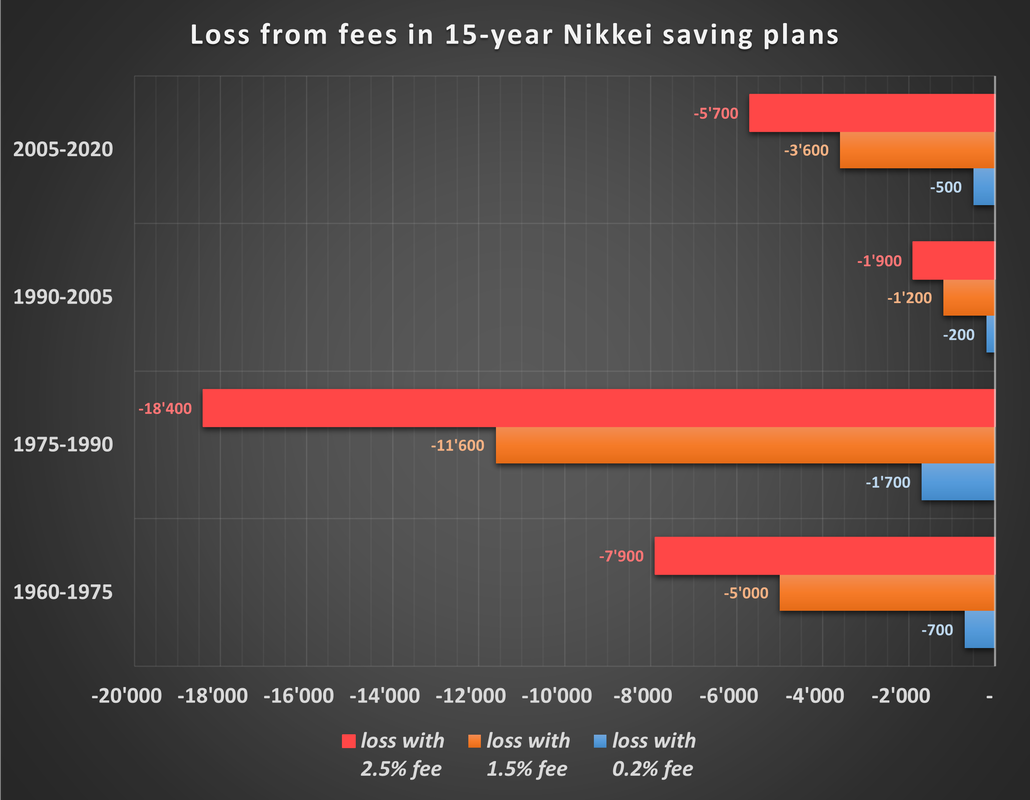
Chart 10 - Losses caused by fees in 15-year Nikkei savings plans with $100 a month between 1960 and 2020.
|
Chart 9 shows that the $18,000 total deposited over 15 years would have resulted in a profit in all but one period from 1960 to 2020.
Without fees, assets of $13,200 (2005) to $87,500 (1990) with an average of $43,000 would have been created.
A savings plan into a product with 0.20% annual fees would not have deviated greatly from the cost-free results. From $13,100 (2005) to $85,800 (1990) and an average of $42,000 would have been available when the savings plans expired. So, the cost was a little less than $1000.
The product with 1.50% annual fees has an average cost of $5000 (Chart 10). The wealth here only ranges from $12,100 (2005) to $75,900 (1990), on average around $38,000.
Particularly expensive products with 2.50% annual fees have an even more dramatic effect with an average cost of $8000 (Chart 10). Only $11,400 (2005) to $69,100 (1990) would have remained for the customer, on average $35,000.
Wealth and cost differences in 30-year Nikkei savings plans with $100 a month

Chart 11 - Nikkei Savings Plan at $100 per month for 30-year periods between 1960 and 2020.
|
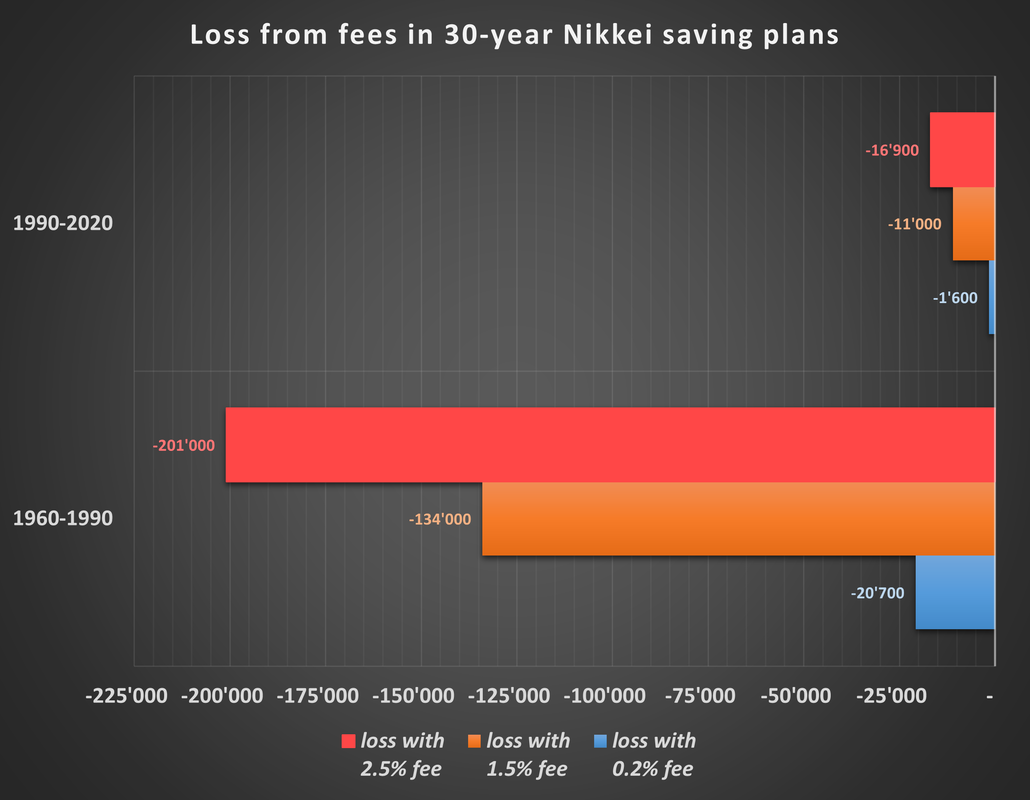
Chart 12 – Losses caused by fees in 30-year Nikkei savings plans with $100 a month between 1960 and 2020.
|
Chart 11 shows that the total of $36,000 deposited over 30 years would have always resulted in a profit in the periods from 1960 to 2020.
Without fees, fortunes of $58,600 (2020) and an incredible $497,800 (1990) would have been created. As bad as the Japanese stock market has been seen since 1990, it was incredibly strong in the decades before. But this has now been forgotten.
A savings plan into a product with 0.20% annual fees would not have deviated greatly from the cost-free results. From $57,000 (2020) to $477,100 (1990) would have been available when the savings plans expired. The costs were therefore around $11,000.
The product with 1.50% annual fees caused an average cost of $70,000 (!) (Chart 12). The fortune here only ranges from $47,600 (2020) to $363,700 (1990).
Particularly expensive products with 2.50% annual fees have an even more dramatic effect with average costs of $110,000 (!!!) (Chart 12). Only $43,800 (2020) and $296,800 (1990) would have remained for the customer.
Wealth and cost differences in 15-year Warren Buffett-savings plans with $100 a month
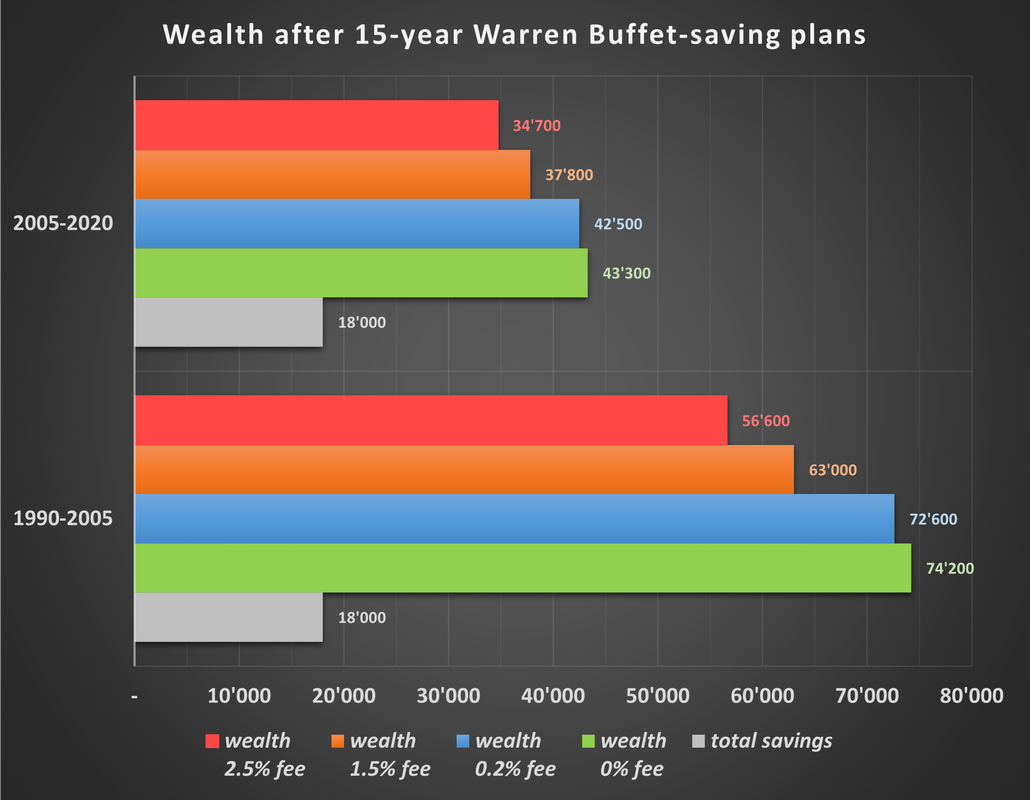
Chart 13 - Warren Buffett Savings Plan at $100 per month for 15-year periods between 1990 and 2020.
|
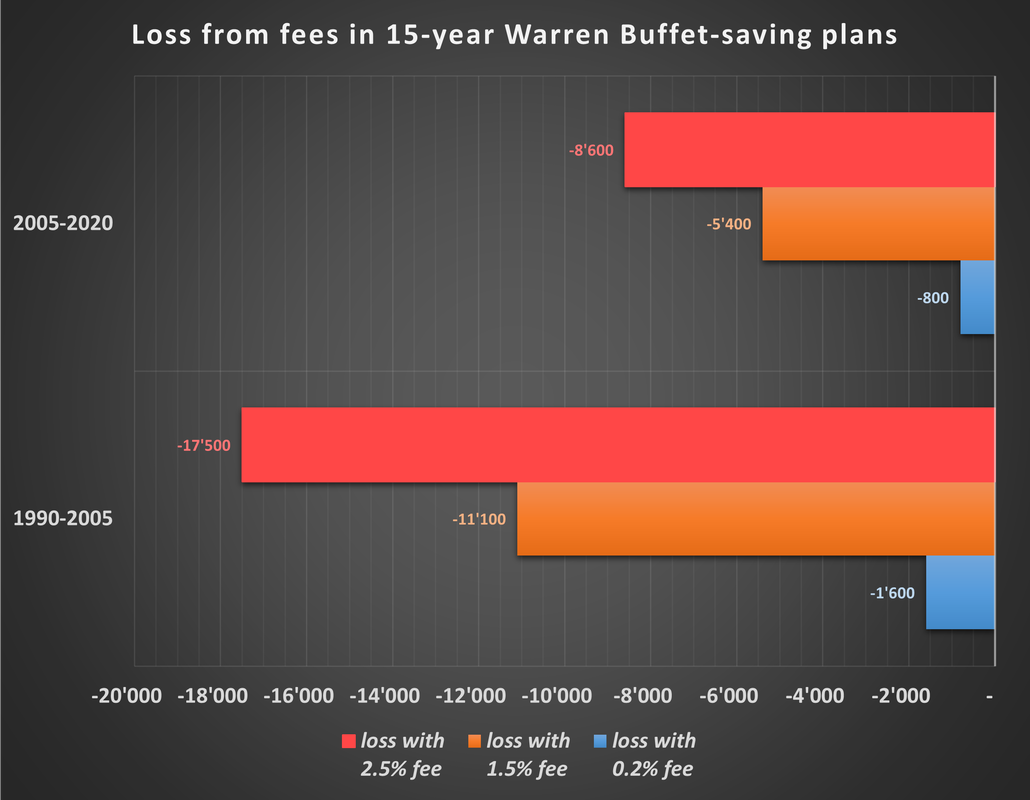
Chart 14 – Losses caused by fees in 15-year Warren Buffet-savings plans with $100 a month between 1960 and 2020.
|
Chart 13 shows that the total of $18,000 deposited over 15 years would have always resulted in a significant profit in the periods from 1990 to 2020.
Without fees, assets of $43,300 (2020) and $74,200 (2005) would have been created.
A savings plan into a product with 0.20% annual fees would not have deviated greatly from the cost-free results. From $42,500 (2020) to $72,600 (2005) would have been available when the savings plans expired. So, the cost was just over $1000.
The product with 1.50% annual fees has an average cost of $8000 (Chart 14). The assets here only range from $37,800 (2020) to $63,000 (2005).
Particularly expensive products with 2.50% annual fees have an even more dramatic effect with an average cost of $13,000 (Chart 14). Only $34,700 (2020) to $56,600 (2005) would have remained for the customer in assets.
Wealth and cost differences in 30-year Warren Buffett-savings plans with $100 a month
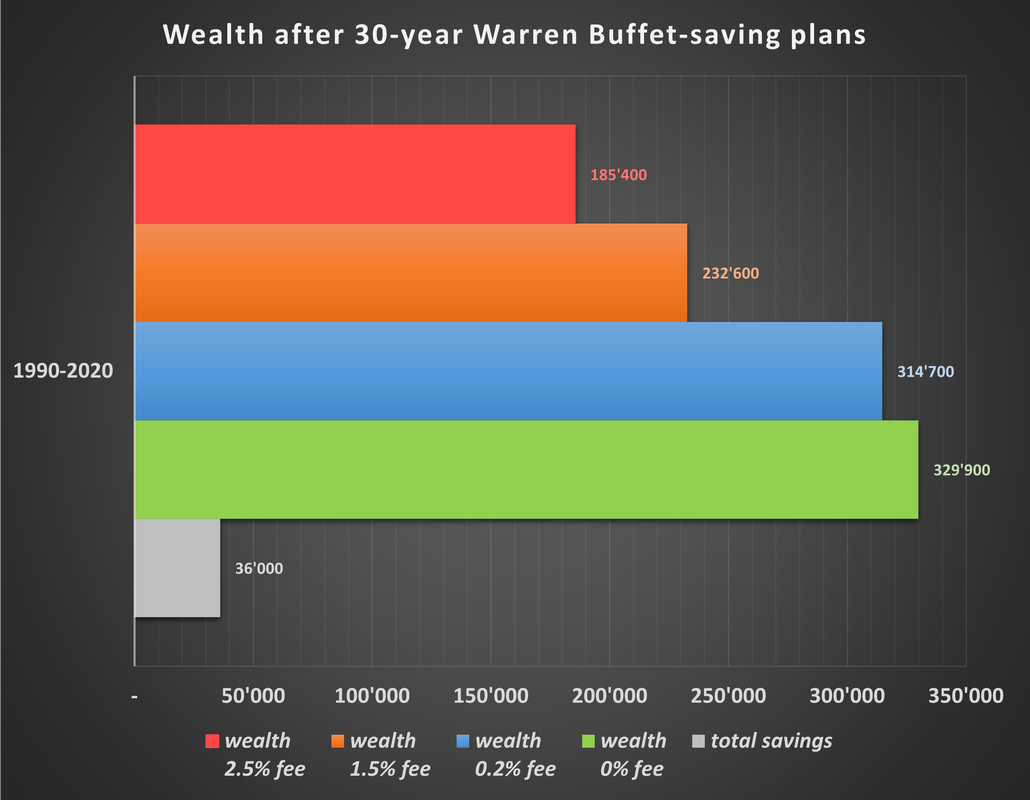
Chart 15 - Warren Buffett Savings Plan at $100 per month for 30-year periods between 1990 and 2020.
|
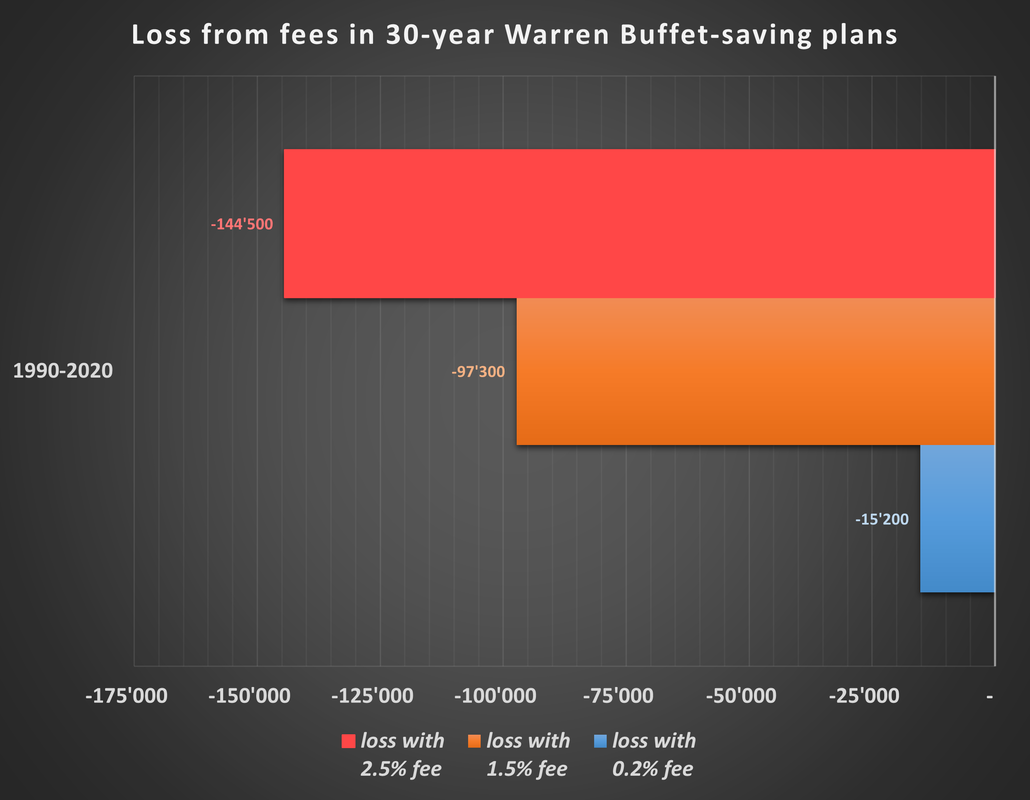
Chart 16 – Fee-related losses in 30-year Warren Buffett savings plans with $100 a month between 1990 and 2020.
|
Chart 15 shows that the total of $36,000 deposited over 30 years would have consistently resulted in a profit in the periods from 1990 to 2020.
Without fees, a fortune of $329,900 would have been created. Warren Buffet lives up to his name, as he was able to outperform all other savings plans in the same period.
A savings plan into a product with 0.20% annual fees would not have deviated greatly from the cost-free outcome. $314,700 would have been available at the end of the savings plan. The costs were therefore around $15,000.
The product with 1.50% in annual fees caused costs of almost $100,000 (!) (Chart 16). The fortune here only reaches $232,600.
Particularly expensive products with 2.50% annual fees have an even more dramatic effect with more than $140,000 (!!!) in costs (Chart 16). The customer would only have had $185,400 left in assets.
Conclusion
Many investors may not be aware how important management fees really are. Otherwise, with long-term investment products having fees of over 1.50%, one would expect customers complaining loudly in view of the horrendous costs over long periods of time.
The comparison of the different time periods shows that the results can be very different depending on the time and market period. The choice of the investment product also plays a decisive role, although the results in similar periods of time are often close to one another on average.
The poor image of the Japanese index seems to be only partially justified in view of the tests carried out in this study. The phase between 1990 and 2005 is certainly one of the weakest periods in the history of a stock market. However, this was also preceded by one of the strongest periods. Given the immense profit opportunities evident across all tests, the "worst case" loss-scenario for savers were still contained with losses in the four-figure range. There is much more upside potential compared to the downside risks.
The full potential offered by the stock market is revealed in the above-average cases. A savings plan in stock market legend Warren Buffet would have brought incredible profits. Of course, one can criticize that in hindsight particularly good stocks can be used for such tests to just get some impressive results. On the other hand, only few would dispute that Warren Buffett's reputation as an exceptional equity manager was not already known in 1990. Thus, the results of these tests can certainly be considered significant in relation to the potential that the stock market can offer to savers. Picking Warren Buffett's stock for a savings plan in 1990 would have been easy for most savers without any special knowledge of the financial markets due to his already existent reputation as a stock market legend.