SYSTINVEST
  • Über
    • über Systinvest
    • Investmentphilosophie
  • Blog
  • Crash Weltkarte
  • Crash Protection
    • Letzter Stand
    • Philosophie
    • Crashphasen Charakteristika
    • Beispiele Marktrisiko
    • Backtests Crash Protection
  • wikifolios
    • Hebel +3faches Risikomanagement
    • Hebel Multistrategien
    • Marktzyklen offensiv gehebelt
    • Marktzyklen
    • Aktienwertselektion mit System
    • Alpha+Beta+Crash Risk Control
  • Ratgeber
    • Wie teuer sollte ein ETF oder Fonds sein?
    • Kann man mit Aktien reich werden?
    • Wie kann man sich vor Inflation schützen?
    • Crash am Aktienmarkt - Wieviel kann man verlieren?
    • Wie riskant sind Aktiensparpläne wirklich?
  • Tools
    • Sparplanrechner
    • Annuitätenrechner
  • Legenden
    • Warren Buffet
    • Edward O. Thorp
    • James Simons
    • "Pitbull" Marty Schwartz
    • Stanley Druckenmiller
  • Analysen
    • Altersvorsorge >
      • Inflation und Kaufkraftverlust
      • Inflationsschutz - Aktien oder Gold?
      • Generationen Altersvorsorge
      • Sparplanvergleich Aktien/Lebensversicherung >
        • Berechnungsannahmen
        • Ohne Steuerbetrachtung
        • Effekt Abgeltungssteuer
        • Effekt Inflation
    • Anlagestrategien >
      • Vola und Sharpe Ratio
      • Aktien mit Vola 2%
      • Momentum
    • Historische Vergleiche >
      • DAX 2016
      • DAX vs S&P 500
  • About
    • About systinvest
    • Investment philosophy
  • Blog
  • Crash World Map
  • Crash Protection
    • Latest Status
    • Philosophy
    • Crashperiod Characteristics
    • Examples Market Risk
    • Backtest Crash Protection
  • wikifolios
    • Leverage +3x Risk Management
    • Leverage Multistrategies
    • Marketcycles leveraged dynamically
    • Marketcycles
    • Systematic Stockpicking
    • Alpha + Beta + Crash Risk Control
  • Good to Know
    • How much should a fund cost?
    • Can you get rich with stocks?
    • How to protect against inflation?
    • Stock Market Crashs - How much can you lose?
    • Are stock saving plans really risky?
  • Tools
    • Savings Plan Calculator
    • Annuity Calculator
  • Analyses
    • Pension >
      • Inflation and Purchasing Power
      • Inflation protection - Stocks or Gold?
      • Cross-Generational Pension Plan
    • Investment Strategies >
      • Vola and Sharpe Ratio
      • Equity with 2% Vola
      • Momentum-en
    • Historical Backtests >
      • DAX 2016-en
      • S&P 500 vs DAX

Analysen

How miserable is the DAX start to 2016 in historical comparison?

The DAX started the new year with a minus of 8.3%. But how bad is the start of 2016 in a historical comparison?

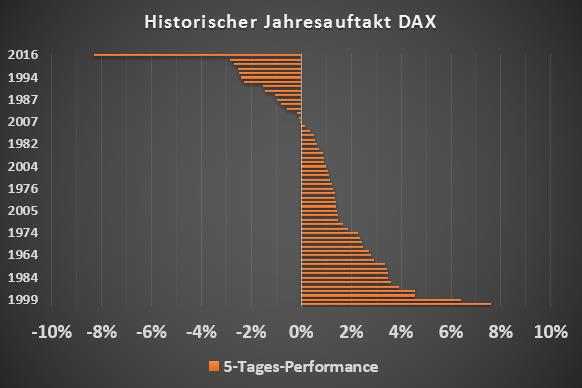
Here is a comparison of all the performances of the DAX that the index has achieved since 1960 in the first five days of a year.

Picture
Picture
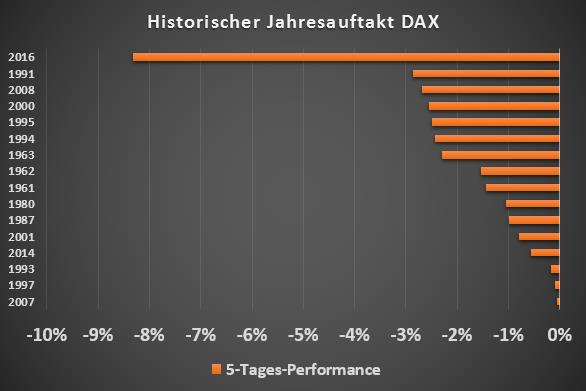
The first picture shows all 5-day performances, while the second picture only shows the years with a negative start to the year.
And you can see that 2016 was the worst start to the year for the DAX in its history. And that's not all: with -8.3%, 1991 was almost beaten by a factor of 3 with the previous negative record of -2.9%. If you look at the individual years with higher negative initial yields, 2016 would add up to years like 1994, 2008 or 2000. All of these are years that most investors should not have the best memories of.

Now one can ask the question whether such negative periods are perhaps not so rare and this year such a period was just a little unfortunate at the start of the year?

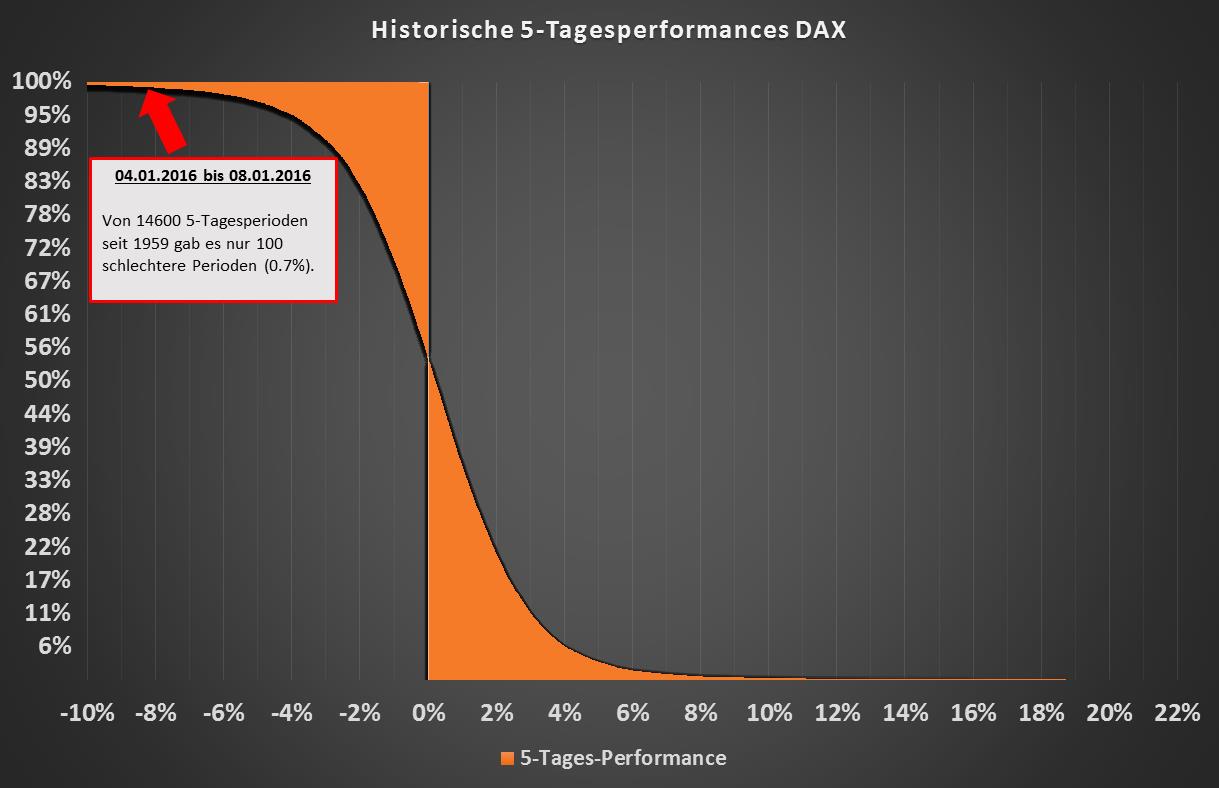
Here is a chart that lists the last week in the entire DAX history.

Picture
Even in an overall historical context, the start of 2016 is an extraordinary event. From around 14600 (overlapping) 5-day periods, there have only been 100 since 1959 in which the DAX has suffered more than it currently does. This corresponds to a historic 0.7% quantile event.
And how did things ultimately go in the years in which the DAX suffered losses at the start?

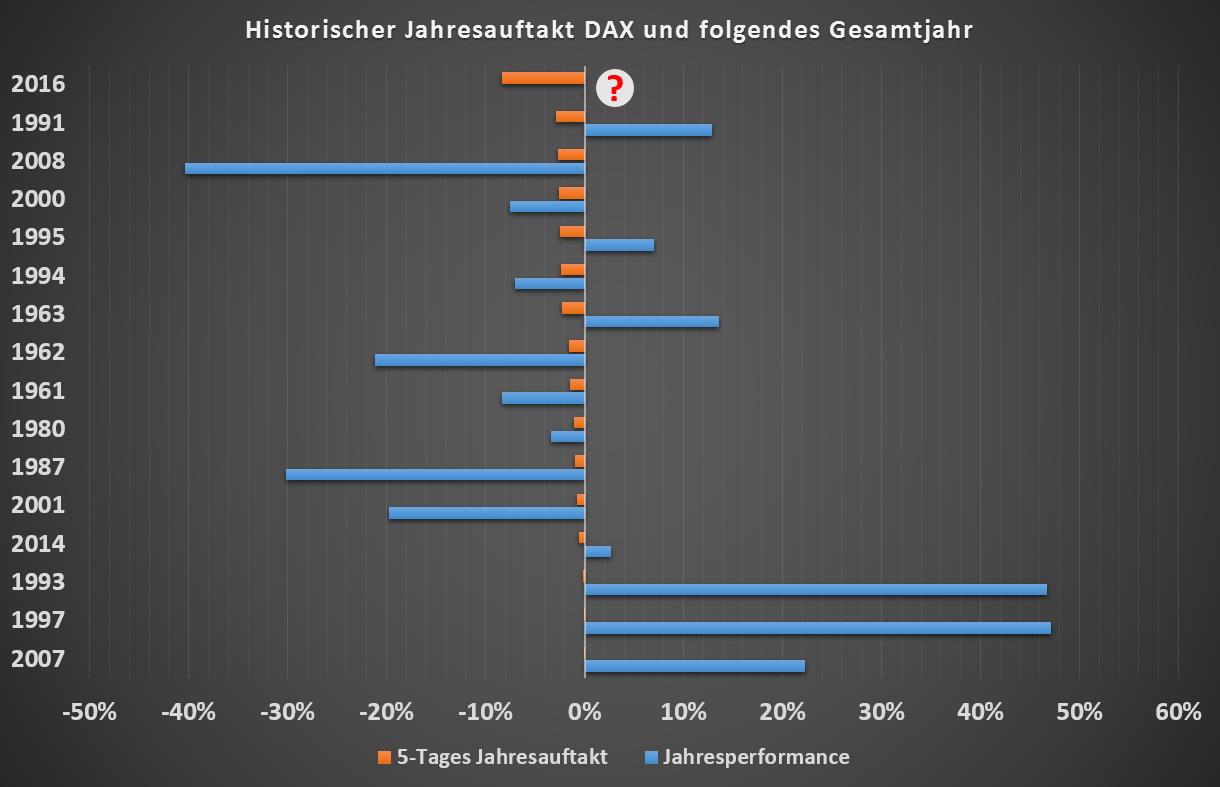
A negative start to the year is not a safe bet for a negative year as a whole, but crisis years with losses of more than 20% such as 2008, 1962, 1987 or 2001 can also be found in this small list.

Picture
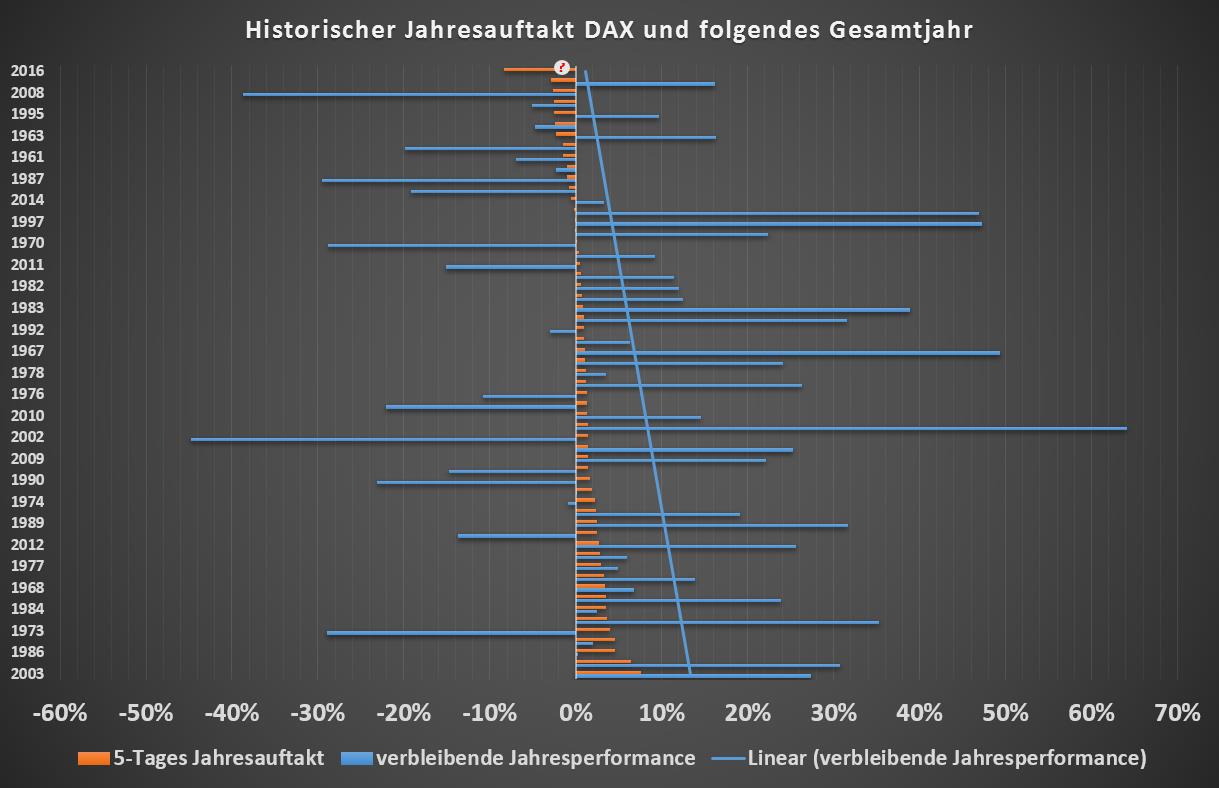
Finally, a chart to answer the question of how the start of the year affects the remaining full-year performance.

It is noticeable that in the years with a negative start, the remaining annual performance tends to be lower. Larger crashes in the remaining year, however, are spread across the entire spectrum of the annual start-up returns.

The linear trend line shows that a negative start to the year should be at least more pessimistic for the remaining year.

Picture
Conclusion
Even if a negative start to the year does not necessarily result in a further negative annual development, in the past it has tended to be a sign of weaker market development. However, it cannot be interpreted as a harbinger of a crash year. Really high annual losses appear historically regardless of what the index does in the first week of the year.
Content
contact@systinvest.com
ÜBER
systinvest.com | Investmentphilosophie
BLOG
CRASH WELTKARTE
CRASH PROTECTION
Letzter Stand | Philosophie | Crashphasen Charakteristika | Beispiele Marktrisiko | Backtests
WIKIFOLIOS
RATGEBER
TOOLS
LEGENDEN
ANALYSEN
​​Altersvorsorge | Anlagestrategien | Historische Vergleiche
KRYPTO
DISCLAIMER
DATENSCHUTZERKLÄRUNG
IMPRESSUM
Content
ABOUT
systinvest.com | Investment Philosophy
BLOG
CRASH WORLD MAP
CRASH PROTECTION
Latest Status | Philosophy | Crashperiod Characteristics | Examples Market Risk | Backtests
WIKIFOLIOS
GOOD TO KNOW
TOOLS
ANALYSES
Pension | Investment Strategies |Historical Backtests
CRYPTO
DISCLAIMER
DATENSCHUTZERKLÄRUNG
IMPRESSUM
  • Über
    • über Systinvest
    • Investmentphilosophie
  • Blog
  • Crash Weltkarte
  • Crash Protection
    • Letzter Stand
    • Philosophie
    • Crashphasen Charakteristika
    • Beispiele Marktrisiko
    • Backtests Crash Protection
  • wikifolios
    • Hebel +3faches Risikomanagement
    • Hebel Multistrategien
    • Marktzyklen offensiv gehebelt
    • Marktzyklen
    • Aktienwertselektion mit System
    • Alpha+Beta+Crash Risk Control
  • Ratgeber
    • Wie teuer sollte ein ETF oder Fonds sein?
    • Kann man mit Aktien reich werden?
    • Wie kann man sich vor Inflation schützen?
    • Crash am Aktienmarkt - Wieviel kann man verlieren?
    • Wie riskant sind Aktiensparpläne wirklich?
  • Tools
    • Sparplanrechner
    • Annuitätenrechner
  • Legenden
    • Warren Buffet
    • Edward O. Thorp
    • James Simons
    • "Pitbull" Marty Schwartz
    • Stanley Druckenmiller
  • Analysen
    • Altersvorsorge >
      • Inflation und Kaufkraftverlust
      • Inflationsschutz - Aktien oder Gold?
      • Generationen Altersvorsorge
      • Sparplanvergleich Aktien/Lebensversicherung >
        • Berechnungsannahmen
        • Ohne Steuerbetrachtung
        • Effekt Abgeltungssteuer
        • Effekt Inflation
    • Anlagestrategien >
      • Vola und Sharpe Ratio
      • Aktien mit Vola 2%
      • Momentum
    • Historische Vergleiche >
      • DAX 2016
      • DAX vs S&P 500
  • About
    • About systinvest
    • Investment philosophy
  • Blog
  • Crash World Map
  • Crash Protection
    • Latest Status
    • Philosophy
    • Crashperiod Characteristics
    • Examples Market Risk
    • Backtest Crash Protection
  • wikifolios
    • Leverage +3x Risk Management
    • Leverage Multistrategies
    • Marketcycles leveraged dynamically
    • Marketcycles
    • Systematic Stockpicking
    • Alpha + Beta + Crash Risk Control
  • Good to Know
    • How much should a fund cost?
    • Can you get rich with stocks?
    • How to protect against inflation?
    • Stock Market Crashs - How much can you lose?
    • Are stock saving plans really risky?
  • Tools
    • Savings Plan Calculator
    • Annuity Calculator
  • Analyses
    • Pension >
      • Inflation and Purchasing Power
      • Inflation protection - Stocks or Gold?
      • Cross-Generational Pension Plan
    • Investment Strategies >
      • Vola and Sharpe Ratio
      • Equity with 2% Vola
      • Momentum-en
    • Historical Backtests >
      • DAX 2016-en
      • S&P 500 vs DAX