
How to be fully invested in equities with less than 2% volatilty
Abstract
Is there a way to invest in the equity market with a realized volatility of less than 2%? What sounds impossible from a first point of view has contrarily to be considered common knowledge. Though, the underlying relation has not often been stated in a formal way.
It is as simple as this, look at your investment horizon. Equities are said to have a volatility of around 20%. This is a misleading information since the risk measure volatility does not consider the investment horizon of an investor or a specific strategy.
An investor who is planning to redeem his money after one year could consider the volatility on his return to be around 20%. On the other hand, a 30-year old investor planning to save for his pension would overestimate the risks in his equity investment if he would not count for the long holding period.
In this analysis, the impact of the investment horizon on the volatility and return of an equity investment is revealed.
Setup
For this analysis three different equity markets will be covered. To cover different global regions, one index is picked to reflect the regions USA, Europe and Asia.
a. Dow Jones Industrial Average Price Index (1929-2016) (ex dividends)
b. German DAX Total Return Index (1959-2016) (inclusive dividends)
c. Japanese Nikkei Price Index (1949-2016) (ex dividends)
|
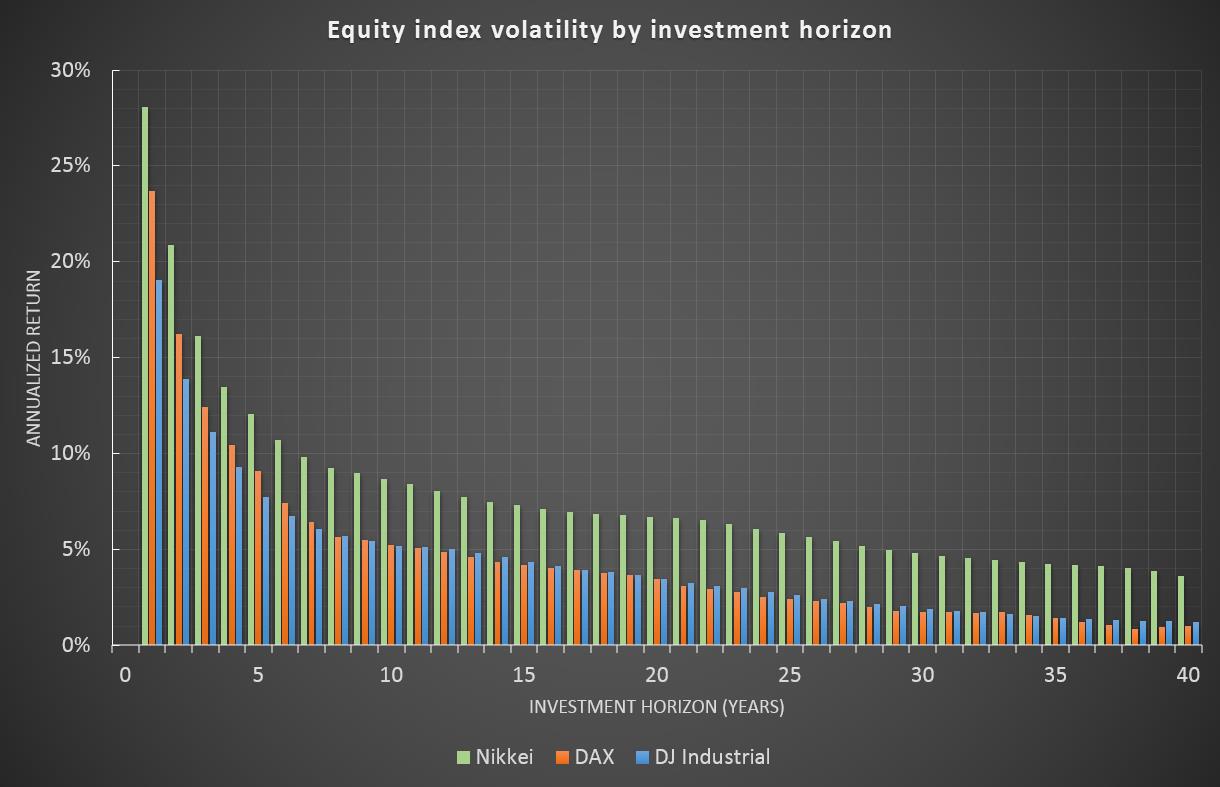
Investment horizon on volatility
The volatility chart shows clearly that the volatility of annualized equity index returns is falling for each of the indices. An investor with an investment horizon of 30 years will face volatilities of less than 5% for each of the indices, Nikkei slightly below 5% while DJI and DAX would be even below 2%. Remark: Assuming a normal distribution of equity returns, volatility falls by the rate "1 divided by square root of investment horizon". (This means 4-year volatility is half as much as the 1-year volatility, 9-year volatility is one third, etc.). |
|
|
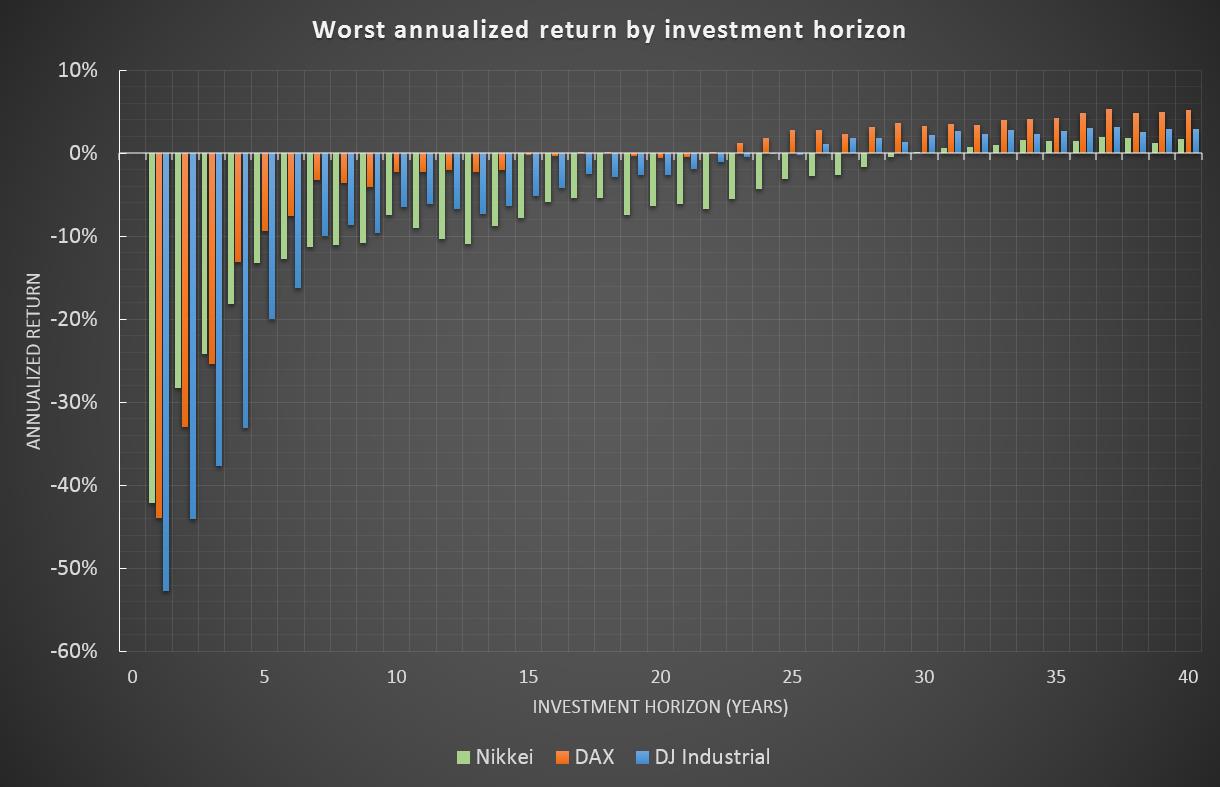
Investment horizon on worst return
Volatility is one side of the coin, but even more important is the worst return an investor had faced during his investment horizon. These figures could be understood as the annualized return of an investor who entered the market in the worst time imaginable, e.g. immediately before the Great Depression started in 1929 or at the height of the 1990s Tech Bubble. As for the volatility, this risk is also declining with increasing investment horizons. An investor with an investment horizon of 30 years or more would not have faced a loss on his investment for each of the indices. |
|
Conclusion
What consequence should be derived from these results?
An investor has to be very careful in applying risk measures. Standard measures like volatility are not reflecting the investment horizon of an investor. Consequence might be, that the risk appetite is underestimated which would lead to a higher weight of cash or bonds. This allocation, which would normally be considered as a more "risk averse" one, might turn out to be a strategy which in fact increases a more severe but hidden risk for longer investment periods - inflation.
Therefore, in all circumstances, investors should always account for their investment horizon. In case of volatility this could be done not only with using a qualitative approach to increase the equity weight for longer horizons by a rule of thumb but with taking into account loss taking capability on a given investment horizon adjusted on a base of x-years-volatility.