
Inflation protection - Stocks or Gold?
Price developments since 1890
Thinking on inflation protection, Gold is assumed to be the best investment possible. Yet, how would stocks perform as inflation protectors? From 1890 until 1930 the US-Dollar has been bound to Gold until US-president Franklin D. Roosevelt expropriate Gold holders by forbidding hoarding of Gold with Executive Order 6102. In 1934 the Gold standard has been reintroduced at an depreciated value. This standard hold until 1971 when the world was surprised by the Nixon shock which canceled the direct international convertability from US-Dollars to Gold until today.
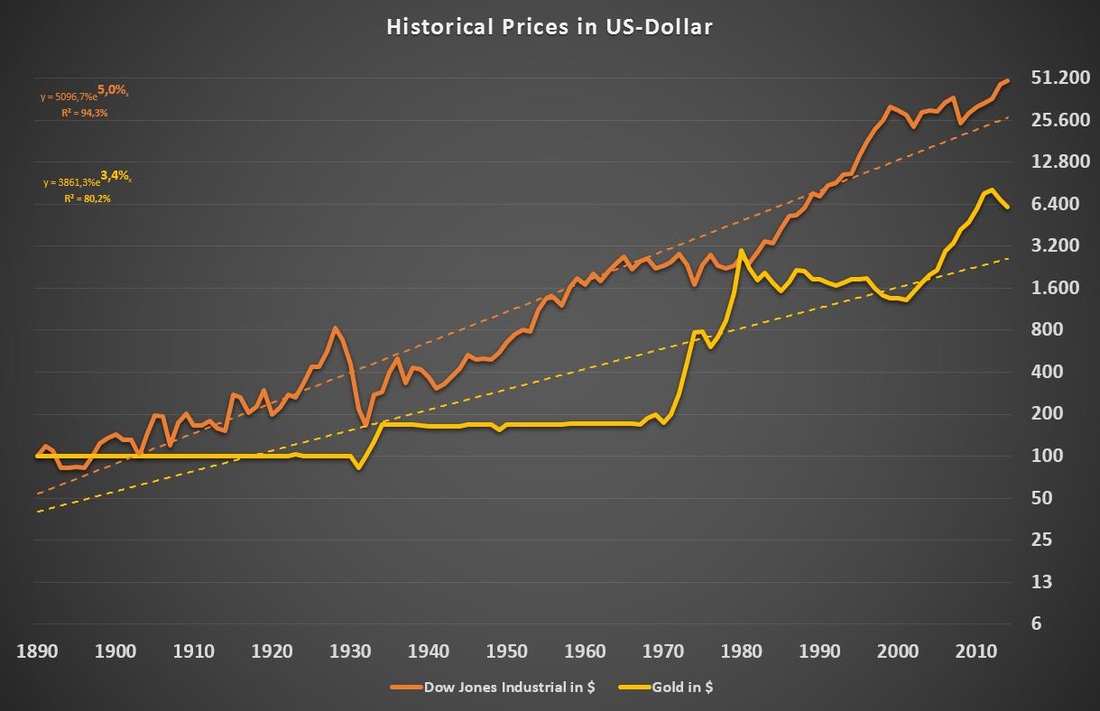
The following chart displays the price developments of Gold and the Dow Jones Industrial Average from 1890 until 2015 (normed to 100 in 1890). There are no dividend returns considered in the Dow Jones index.
The following chart displays the price developments of Gold and the Dow Jones Industrial Average from 1890 until 2015 (normed to 100 in 1890). There are no dividend returns considered in the Dow Jones index.
|
By comparing Gold with the Dow Jones it is pretty clear that an equity investor would have gained higher profits than a gold investor. The long-term price return for the Dow Jones equals +5.0% annually while Gold only achieves +3.4%. Additionally, dividend returns are not even taken into account in the Dow Jones returns.
Looking at the Gold chart one can see two periods with steep increases (1970-1980, 2000-2010) and one period of a lasting decline in prices (1980-2000) besides long-lasting flat peridos. For the Dow Jones the impact of the Great Depression in the 1930s stands out. Despite that, periods of steep increases (1940-1965, 1980-2000) seems to alternate with periods of volatile stagnation (1965-1980, 2000-2010). |
Dow Jones Industrial Average measured in Gold instead of US-Dollars
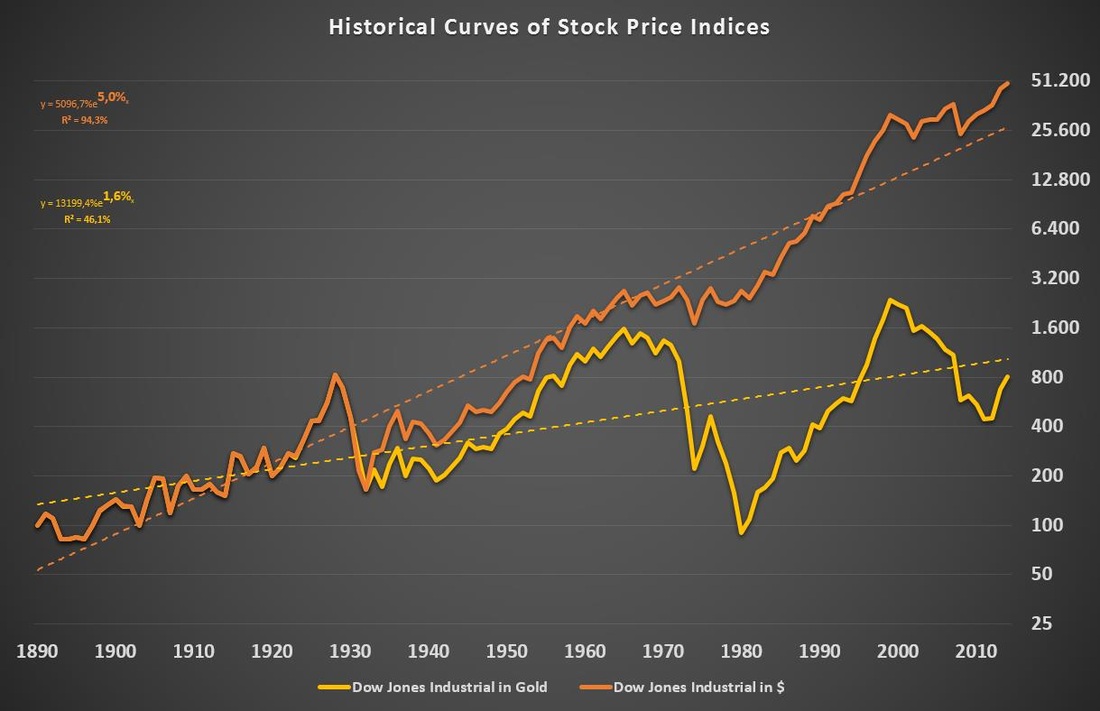
Comparing developments of the Dow Jones and Gold one can see that they seem to alternate in periods of steep increases. This contrarian effect becomes even more obvious if the Dow Jones is displayed in terms of Gold instead of US-Dollar.
|
Because of the Gold standard there is no significant difference in the two charts until the 1970s. After the Nixon shock one can see that the charts start to diverge.
While the 70s crash appears to be a period of stagnation according to the price chart, a look on the Gold chart gives the impression that it was the major stock market crash of the 20th century. It was even exceeding the drawdown during the Great Depression. The Dow Jones would still be below its pre-crisis level of 1960 if it was measured in a Gold standard. The long-term trend of the Dow Jones measured in Gold is +1.6%. During the last years it appreciated versus Gold in a way which has not been the case since the 1980s. |
Inflation-adjusted S&P 500 compared with Dow Jones Industrial Average (in US-Dollar and Gold)
As we have just seen, stock market indices seems to provide superior long-term returns compared with Gold. Could we therefore assume that stock market indices are a better inflation protector?

|
According to that chart the inflation-adjusted S&P 500 returned +1.9% annually since 1890 without taking into account dividend returns.
Previously we observed that the Dow Jones outperformed Gold on the long-run with +1.6% annually. Taking both figures into account, the inflation-adjusted return of Gold seems to be around +0.3% annually. From 1890 on an equity index appears to be the better inflation protector. In fact, an equity investor would have increased his wealth on real terms even without taking dividends into account while a Gold investor would just have preserved his wealth. |
Period from 1970 until 2014
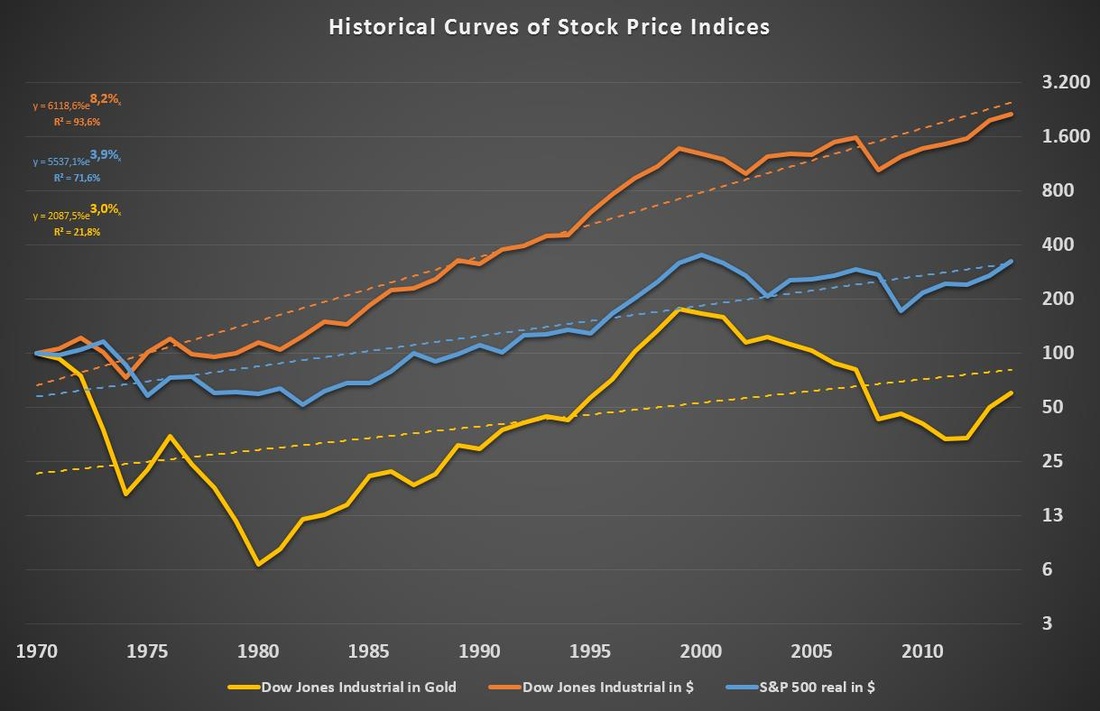
Finally, the long period of the Gold standard is exluded from our analysis.
|
The Dow Jones shows a nominal return of +8.2% annually while the inflation-adjusted S&P 500 is returning +3.9% annually on real terms. The average trend of the Dow Jones versus Gold shows a return of +3.0% annually which means the real return of Gold was approximately +0.9% annually.
Looking at the inflation-adjusted S&P 500, it seems that stocks go through alternate periods of increasing purchasing power (1980-2000, 2008-2014) and decreasing purchasing power (1970-1980, 2000-2008). Comparing the development of the Dow Jones measured in Gold to this unveils a high correlaton between both charts. Thus, it seems that in some periods Gold appears to be the better inflation protector (1970-1980, 2000-2010) while in others an equity index is superior (1980-2000, since 2010). |
Conclusion
A general conclusion whether stocks or Gold are superior inflation protectors is not possible. Taking all results since 1890 into account three major insights can be derived.
Finally, one could say that equity indices could be preferred as a protection against inflation due to their ability to increase purchasing power on the long run. Taking dividend returns into account this becomes even more clear. From a risk point of view, a combination of equity indices and Gold could provide more stable inflation protection due to a negative correlation of Gold and equity indices and the ability of both to either increase purchasing power (equities) or preserve purchasing power (Gold).
- An equity index increases purchasing power on average by +1.9% annually. Dividend returns are not included in this figure.
- Prices of equity indices outperform Gold on the long-run by +1.6% annually even without taking dividends into account.
- Equity indices and Gold are negatively correlated since the 1970 Nixon shock and have provided protection against inflation alternately.
Finally, one could say that equity indices could be preferred as a protection against inflation due to their ability to increase purchasing power on the long run. Taking dividend returns into account this becomes even more clear. From a risk point of view, a combination of equity indices and Gold could provide more stable inflation protection due to a negative correlation of Gold and equity indices and the ability of both to either increase purchasing power (equities) or preserve purchasing power (Gold).