
Momentum effect - Do stocks have a memory?
What is Momentum?
Following common academic assumptions on stock market returns they do not have a memory. That means, that stock market returns of tomorrow are completely indepedent of today's return. One could say that a market does not remember what has happened before. On each day, the dice market return seems to be thrown freshly.
Practitioners on the other hand do talk a lot about a strategy called Momentum. Though there is a wide range of how Momentum can be defined precisely, all such strategies share the assumption that markets tend to build market trends. If that is true, markets would indeed have a memory since a good past performance could be an indication of ongoing future benefits.
Who is right - the academics or the practitioners?
Used data and test setup
In order to test the Momentum effect the following setup has been applied:
In order to test the Momentum effect the following setup has been applied:
- Historical monthly returns of stock market indices (S&P 500, DAX, Stoxx 600, Nikkei 225, MSCI World) (source investing.com)
- Available history of the data differs for the indices. While DAX reaches back until 1988 the others start between 2002 and 2005.
- Mainly total return indices have been used with one exception (MSCI World).
- Theoretical returns are based on an assumed normal distribution of market returns. Mean and volatility have been estimated from historical data.
Theoretical returns (=no memory)
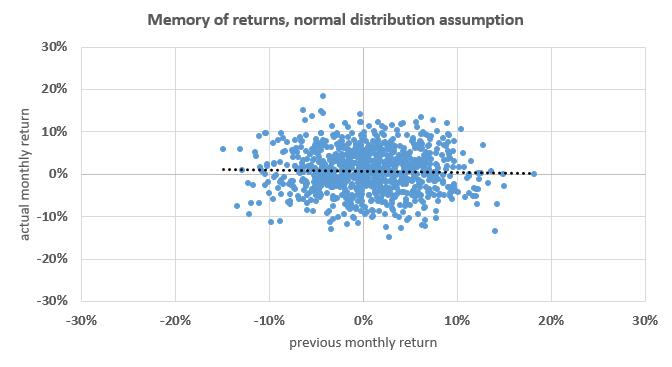
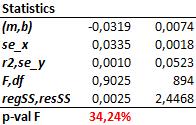
Chart und statistical data, based on an assumed normal distribution.
Chart und statistical data, based on an assumed normal distribution.
|
|
Following the theory stock markets do not have a memory.
How can one come to this conclusion?
How can one come to this conclusion?
- The point cloud does not show any trend and the dotted regression line is flat.
- The p-value of the statistics is quite high (34%). This means that the statistics might be coincidental with quite high probability.
Historical returns
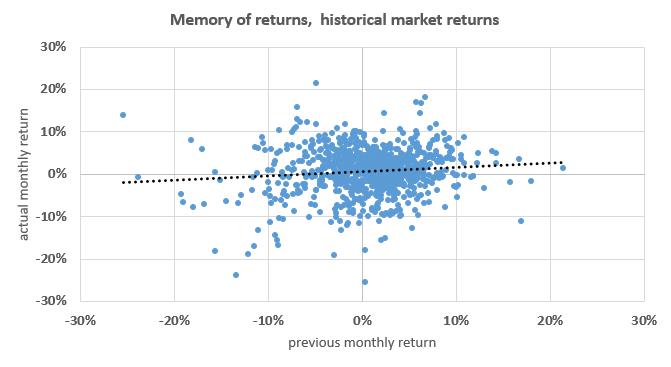
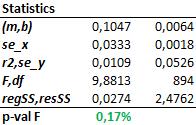
How do chart and statistics look like for the real historical market data?
How do chart and statistics look like for the real historical market data?
|
|
The real market return history shows that stock markets might have a memory.
How can one come to this conclusion?
How can one come to this conclusion?
- The point cloud shows a trend despite being dispersed. The corresponding regression line has a positive slope which means that higher actual returns could be indicative for higher future returns.
- The p-value of the statistics is quite low (0.17%). This means that the probability that these results occured by coincidence is quite low.
Conclusion
According to real market data the normal distribution assumption has to be withdrawn (and consequently all market theories which are based on it). Beyond that this test setup verified the existence of the Momentum effect.
Side note
In addition to the Momentum effect a comparison of both charts illustrates another attrbiute of real market returns compared to their theoretical assumption. The dispersion of the real returns is obviously wider than the one of the theorietical returns, especially for very high market losses. Consequently, an investor who applies risk models based on a normal distribution assumption might underestimate the risk of very high losses.