SYSTINVEST
  • Über
    • über Systinvest
    • Investmentphilosophie
  • Blog
  • Crash Weltkarte
  • Crash Protection
    • Letzter Stand
    • Philosophie
    • Crashphasen Charakteristika
    • Beispiele Marktrisiko
    • Backtests Crash Protection
  • wikifolios
    • Hebel +3faches Risikomanagement
    • Hebel Multistrategien
    • Marktzyklen offensiv gehebelt
    • Marktzyklen
    • Aktienwertselektion mit System
    • Alpha+Beta+Crash Risk Control
  • Ratgeber
    • Wie teuer sollte ein ETF oder Fonds sein?
    • Kann man mit Aktien reich werden?
    • Wie kann man sich vor Inflation schützen?
    • Crash am Aktienmarkt - Wieviel kann man verlieren?
    • Wie riskant sind Aktiensparpläne wirklich?
  • Tools
    • Sparplanrechner
    • Annuitätenrechner
  • Legenden
    • Warren Buffet
    • Edward O. Thorp
    • James Simons
    • "Pitbull" Marty Schwartz
    • Stanley Druckenmiller
  • Analysen
    • Altersvorsorge >
      • Inflation und Kaufkraftverlust
      • Inflationsschutz - Aktien oder Gold?
      • Generationen Altersvorsorge
      • Sparplanvergleich Aktien/Lebensversicherung >
        • Berechnungsannahmen
        • Ohne Steuerbetrachtung
        • Effekt Abgeltungssteuer
        • Effekt Inflation
    • Anlagestrategien >
      • Vola und Sharpe Ratio
      • Aktien mit Vola 2%
      • Momentum
    • Historische Vergleiche >
      • DAX 2016
      • DAX vs S&P 500
  • About
    • About systinvest
    • Investment philosophy
  • Blog
  • Crash World Map
  • Crash Protection
    • Latest Status
    • Philosophy
    • Crashperiod Characteristics
    • Examples Market Risk
    • Backtest Crash Protection
  • wikifolios
    • Leverage +3x Risk Management
    • Leverage Multistrategies
    • Marketcycles leveraged dynamically
    • Marketcycles
    • Systematic Stockpicking
    • Alpha + Beta + Crash Risk Control
  • Good to Know
    • How much should a fund cost?
    • Can you get rich with stocks?
    • How to protect against inflation?
    • Stock Market Crashs - How much can you lose?
    • Are stock saving plans really risky?
  • Tools
    • Savings Plan Calculator
    • Annuity Calculator
  • Analyses
    • Pension >
      • Inflation and Purchasing Power
      • Inflation protection - Stocks or Gold?
      • Cross-Generational Pension Plan
    • Investment Strategies >
      • Vola and Sharpe Ratio
      • Equity with 2% Vola
      • Momentum-en
    • Historical Backtests >
      • DAX 2016-en
      • S&P 500 vs DAX

Crash Protection

Characteristics of Crash Periods

In retrospect, stock market crashes seem to happen suddenly and intensively. Analyzing crash periods in a systematic way will cast a new light on these periods.
Duration of Crashs
Bild
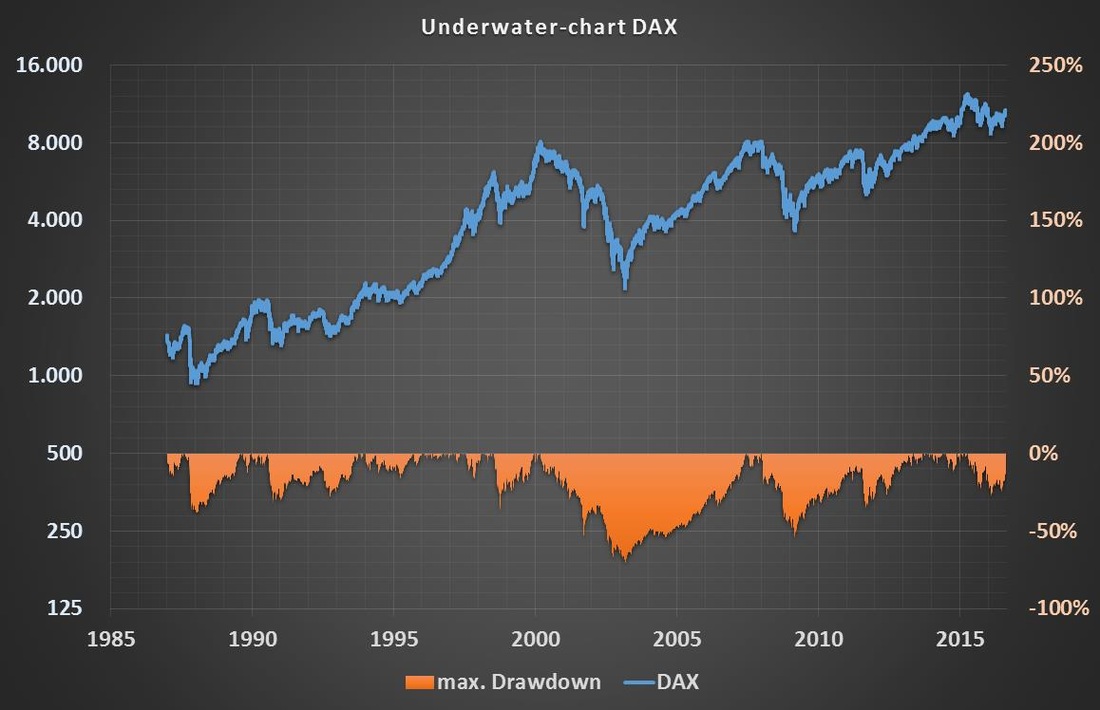
In this underwater-chart the long-term performance of the largest german stock market index DAX is shown together with its drawdowns.

Periods of high losses from 30% to 70% seem not to occur suddenly. Contrarily, these losses seem to occur after several months. During the worst crises in 2003 and 2008 it took 1-3 years for the DAX to reach a low from a previous high.


Bild
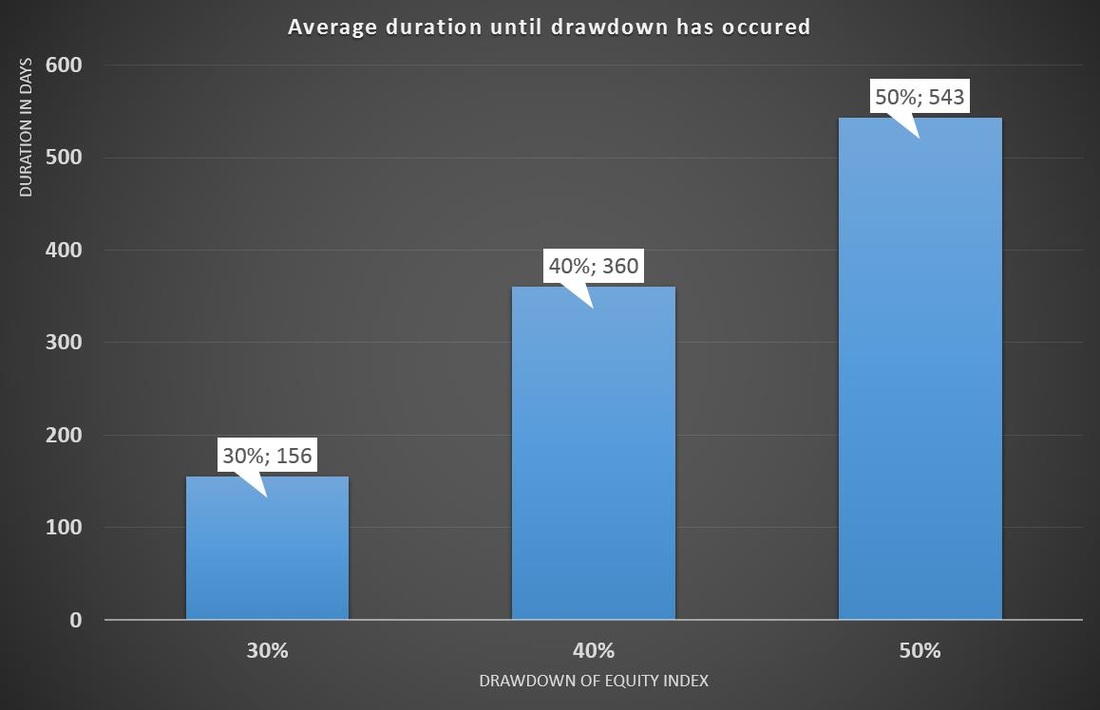
Comparing 17 global stock market indices between 1986 and 2016, one can see that it took on average nearly half a year for an index to suffer losses of 30%. Before a loss of 40% occurs it took on average nearly one year. An equity index loss of 50% needs 1.5 years to occur.

These figures illustrate that a stock market crash has generally a duration of several months. The intuition that a crash appears suddenly has to be withdrawn.
Simultaneity of Crashs
Comparing periods of crashes for different stock market indices unveils another useful attribut.
Bild
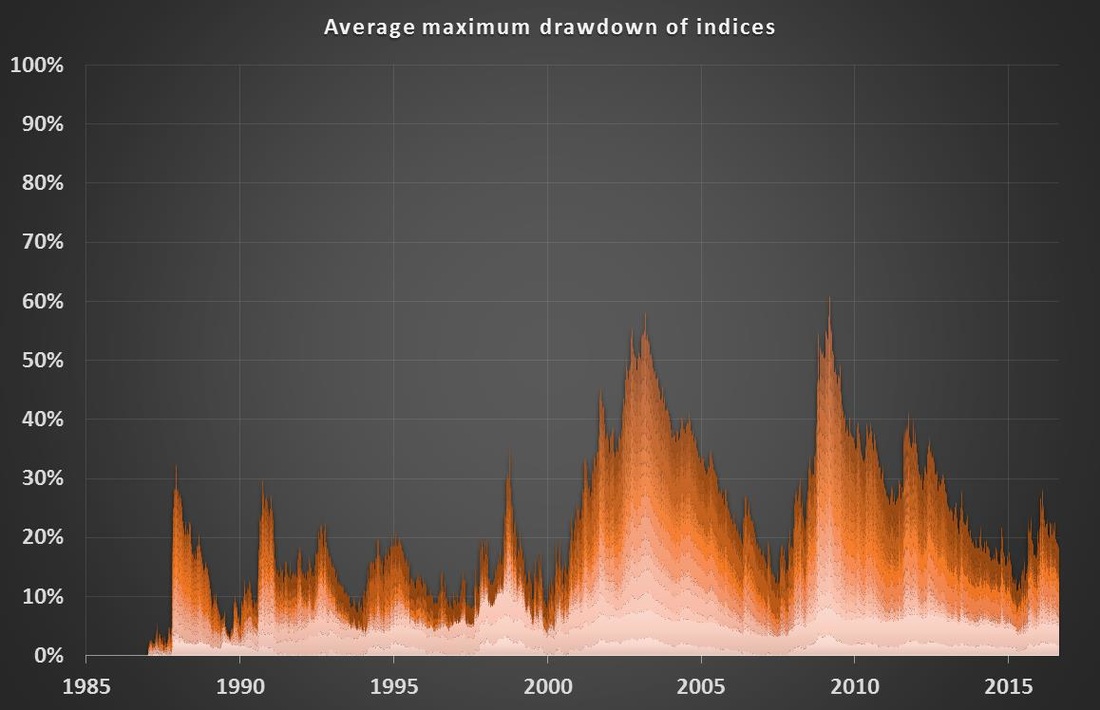
This chart illustrates the average maximum drawdown of several stock indices. From this, an attribut uncovers itself which a lot of investors complain about during crash periods. During a stock market crisis correlation among markets are much higher than in risk-on periods. Therefore, the classical risk-reducing strategy of diversification is not working anymore as effective as during less risky market periods. It seems that diversificaton might fail just during times when investors would need it most.

During a crisis high drawdowns occur simultaneously.
Bild
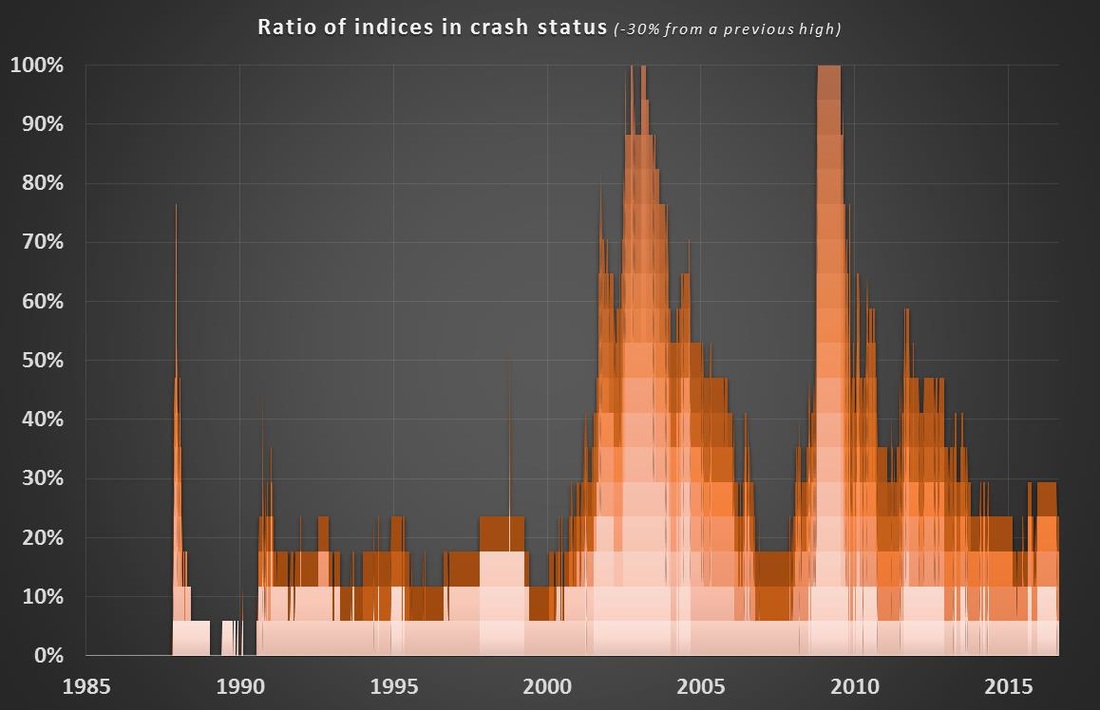
The conclusion from the previous chart becomes even clearer if one is looking at the ratio of stock market indices which are in the status of a crash at the moment. For this purpose, one index is considered to be in a crash status after having suffered a maximum drawdown of more than 30%.

This chart illustrates that during the crises of 2003 and 2008 nearly all of the observed indices happened to be in this crash status. So, during a crash period losses of 30% and more will affect the majority of stock indices simultaneously.
Conclusion
Following the evidence provided above, the intuitive assumption that a stock market crash happens suddenly and intensively has to be withdrawn. Even if shocking moments like 9/11 or the default of Lehman Brothers shaked the markets, the real high drawdowns an equity investor will face have durations from several months to years.

Having attributes like simultaneously and a long duration, a stock market crash can be handled with a dynamic systematic strategy like Crash Protection. Applying such a strategy might reduce the drawdowns an equity investor will face during such times.

go to historic examples of market risk
Content
contact@systinvest.com
ÜBER
systinvest.com | Investmentphilosophie
BLOG
CRASH WELTKARTE
CRASH PROTECTION
Letzter Stand | Philosophie | Crashphasen Charakteristika | Beispiele Marktrisiko | Backtests
WIKIFOLIOS
RATGEBER
TOOLS
LEGENDEN
ANALYSEN
​​Altersvorsorge | Anlagestrategien | Historische Vergleiche
KRYPTO
DISCLAIMER
DATENSCHUTZERKLÄRUNG
IMPRESSUM
Content
ABOUT
systinvest.com | Investment Philosophy
BLOG
CRASH WORLD MAP
CRASH PROTECTION
Latest Status | Philosophy | Crashperiod Characteristics | Examples Market Risk | Backtests
WIKIFOLIOS
GOOD TO KNOW
TOOLS
ANALYSES
Pension | Investment Strategies |Historical Backtests
CRYPTO
DISCLAIMER
DATENSCHUTZERKLÄRUNG
IMPRESSUM
  • Über
    • über Systinvest
    • Investmentphilosophie
  • Blog
  • Crash Weltkarte
  • Crash Protection
    • Letzter Stand
    • Philosophie
    • Crashphasen Charakteristika
    • Beispiele Marktrisiko
    • Backtests Crash Protection
  • wikifolios
    • Hebel +3faches Risikomanagement
    • Hebel Multistrategien
    • Marktzyklen offensiv gehebelt
    • Marktzyklen
    • Aktienwertselektion mit System
    • Alpha+Beta+Crash Risk Control
  • Ratgeber
    • Wie teuer sollte ein ETF oder Fonds sein?
    • Kann man mit Aktien reich werden?
    • Wie kann man sich vor Inflation schützen?
    • Crash am Aktienmarkt - Wieviel kann man verlieren?
    • Wie riskant sind Aktiensparpläne wirklich?
  • Tools
    • Sparplanrechner
    • Annuitätenrechner
  • Legenden
    • Warren Buffet
    • Edward O. Thorp
    • James Simons
    • "Pitbull" Marty Schwartz
    • Stanley Druckenmiller
  • Analysen
    • Altersvorsorge >
      • Inflation und Kaufkraftverlust
      • Inflationsschutz - Aktien oder Gold?
      • Generationen Altersvorsorge
      • Sparplanvergleich Aktien/Lebensversicherung >
        • Berechnungsannahmen
        • Ohne Steuerbetrachtung
        • Effekt Abgeltungssteuer
        • Effekt Inflation
    • Anlagestrategien >
      • Vola und Sharpe Ratio
      • Aktien mit Vola 2%
      • Momentum
    • Historische Vergleiche >
      • DAX 2016
      • DAX vs S&P 500
  • About
    • About systinvest
    • Investment philosophy
  • Blog
  • Crash World Map
  • Crash Protection
    • Latest Status
    • Philosophy
    • Crashperiod Characteristics
    • Examples Market Risk
    • Backtest Crash Protection
  • wikifolios
    • Leverage +3x Risk Management
    • Leverage Multistrategies
    • Marketcycles leveraged dynamically
    • Marketcycles
    • Systematic Stockpicking
    • Alpha + Beta + Crash Risk Control
  • Good to Know
    • How much should a fund cost?
    • Can you get rich with stocks?
    • How to protect against inflation?
    • Stock Market Crashs - How much can you lose?
    • Are stock saving plans really risky?
  • Tools
    • Savings Plan Calculator
    • Annuity Calculator
  • Analyses
    • Pension >
      • Inflation and Purchasing Power
      • Inflation protection - Stocks or Gold?
      • Cross-Generational Pension Plan
    • Investment Strategies >
      • Vola and Sharpe Ratio
      • Equity with 2% Vola
      • Momentum-en
    • Historical Backtests >
      • DAX 2016-en
      • S&P 500 vs DAX