SYSTINVEST
  • Über
    • über Systinvest
    • Investmentphilosophie
  • Blog
  • Crash Weltkarte
  • Crash Protection
    • Letzter Stand
    • Philosophie
    • Crashphasen Charakteristika
    • Beispiele Marktrisiko
    • Backtests Crash Protection
  • wikifolios
    • Hebel +3faches Risikomanagement
    • Hebel Multistrategien
    • Marktzyklen offensiv gehebelt
    • Marktzyklen
    • Aktienwertselektion mit System
    • Alpha+Beta+Crash Risk Control
  • Ratgeber
    • Wie teuer sollte ein ETF oder Fonds sein?
    • Kann man mit Aktien reich werden?
    • Wie kann man sich vor Inflation schützen?
    • Crash am Aktienmarkt - Wieviel kann man verlieren?
    • Wie riskant sind Aktiensparpläne wirklich?
  • Tools
    • Sparplanrechner
    • Annuitätenrechner
  • Legenden
    • Warren Buffet
    • Edward O. Thorp
    • James Simons
    • "Pitbull" Marty Schwartz
    • Stanley Druckenmiller
  • Analysen
    • Altersvorsorge >
      • Inflation und Kaufkraftverlust
      • Inflationsschutz - Aktien oder Gold?
      • Generationen Altersvorsorge
      • Sparplanvergleich Aktien/Lebensversicherung >
        • Berechnungsannahmen
        • Ohne Steuerbetrachtung
        • Effekt Abgeltungssteuer
        • Effekt Inflation
    • Anlagestrategien >
      • Vola und Sharpe Ratio
      • Aktien mit Vola 2%
      • Momentum
    • Historische Vergleiche >
      • DAX 2016
      • DAX vs S&P 500
  • About
    • About systinvest
    • Investment philosophy
  • Blog
  • Crash World Map
  • Crash Protection
    • Latest Status
    • Philosophy
    • Crashperiod Characteristics
    • Examples Market Risk
    • Backtest Crash Protection
  • wikifolios
    • Leverage +3x Risk Management
    • Leverage Multistrategies
    • Marketcycles leveraged dynamically
    • Marketcycles
    • Systematic Stockpicking
    • Alpha + Beta + Crash Risk Control
  • Good to Know
    • How much should a fund cost?
    • Can you get rich with stocks?
    • How to protect against inflation?
    • Stock Market Crashs - How much can you lose?
    • Are stock saving plans really risky?
  • Tools
    • Savings Plan Calculator
    • Annuity Calculator
  • Analyses
    • Pension >
      • Inflation and Purchasing Power
      • Inflation protection - Stocks or Gold?
      • Cross-Generational Pension Plan
    • Investment Strategies >
      • Vola and Sharpe Ratio
      • Equity with 2% Vola
      • Momentum-en
    • Historical Backtests >
      • DAX 2016-en
      • S&P 500 vs DAX

Crash Protection

Backtests Crash Protection-Strategy

Results during multi-decade-long periods
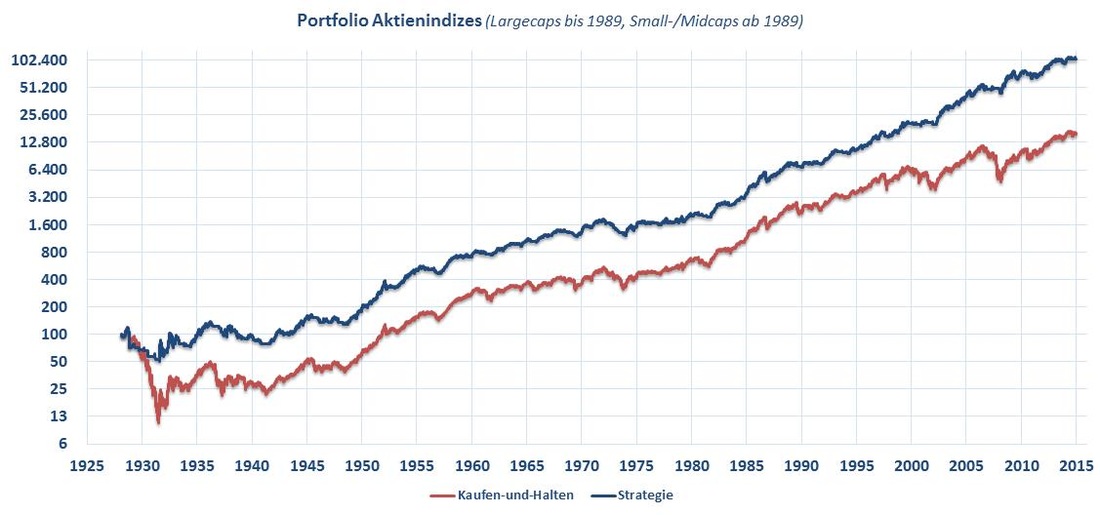
For the following backtests a portfolio of stock market indices has been applied. The simulation starts in 1929 and compares the Crash Protection strategy with a simple buy-and-hold strategy

From 1929 until 1988 the portfolio consists of large cap stock market indices due to availability of data. From 1988 until 2015 a portfolio of small- and midcap indices has been applied. The results from 1988 until 2015 are additionally illustrated seperately.


On each rebalance date the indices have been weighted equally. Transactioncosts are assumed to be 0.30% per trade.


1929-2015 (Portfolio stock market indices)
Crash Protection-Strategy:
  • 8.3%, 58%   (annual return, maximum drawdown)
Buy-and-hold:
  • 6.0%, 91%   (annual return, maximum drawdown)

=> Winner on Risk and Return: Crash Protection
Picture
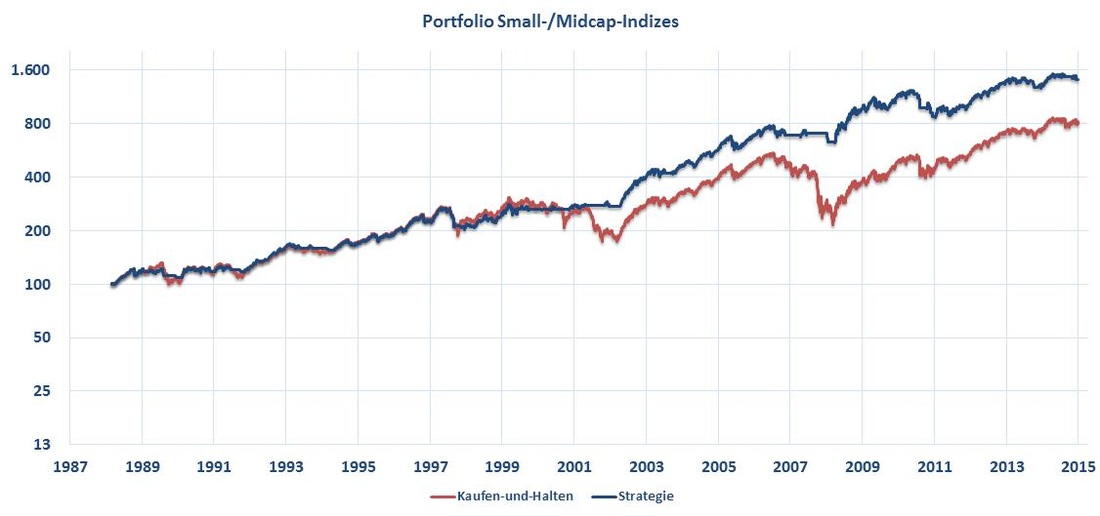
1988-2015 (Portfolio of small-/midcap-indices)
Crash Protection-Strategy:
  • 10.4%, 30%   (annual return, maximum drawdown)
Buy-and-hold:
  •   8.2%, 61%   (annual return, maximum drawdown)

=> Winner on Risk and Return: Crash Protection
Picture

Results in different decade-long periods
Following below are the simulation results for different decade-long periods beginning in 1929. As before, until 1988 large cap stock market indices has been chosen and small-/midcap indices from 1988 on. Generally, small- and midcap indices are preferred over large indices due to higher returns over the long run thanks to a size risk premia. Nevertheless, due to a lack of data availability for these indices before 1988 large cap stock market indices have been used for these simulations.


On each rebalance date the indices have been weighted equally. Transactioncosts are assumed to be 0.30% per trade.


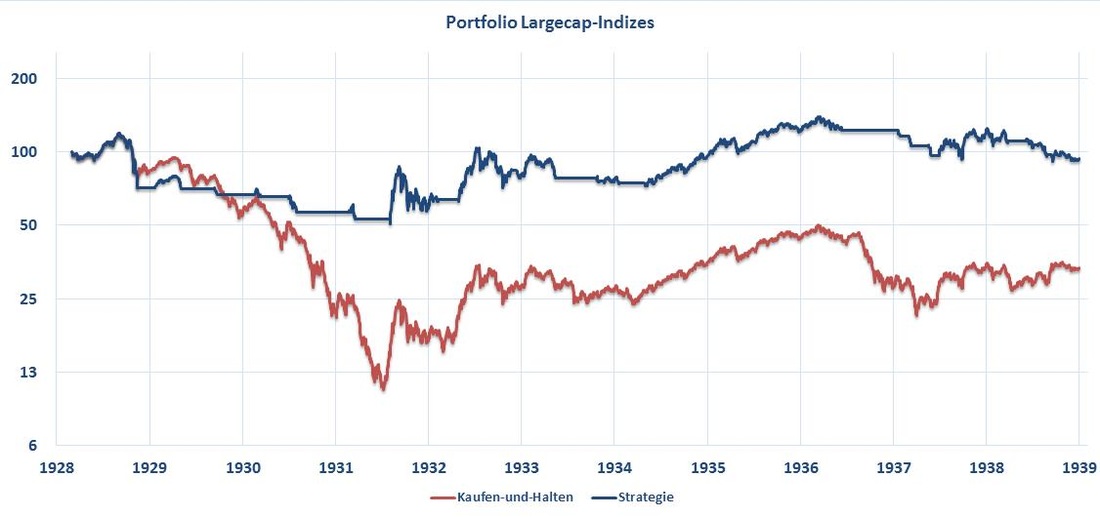
1928-1939 (Portfolio of large cap-indices)
Crash Protection-Strategy:
  • -0.5%, 58%   (annual return, maximum drawdown)
Buy-and-hold:
  • -9.5%, 91%   (annual return, maximum drawdown)

=> Winner on Risk and Return: Crash Protection
Picture
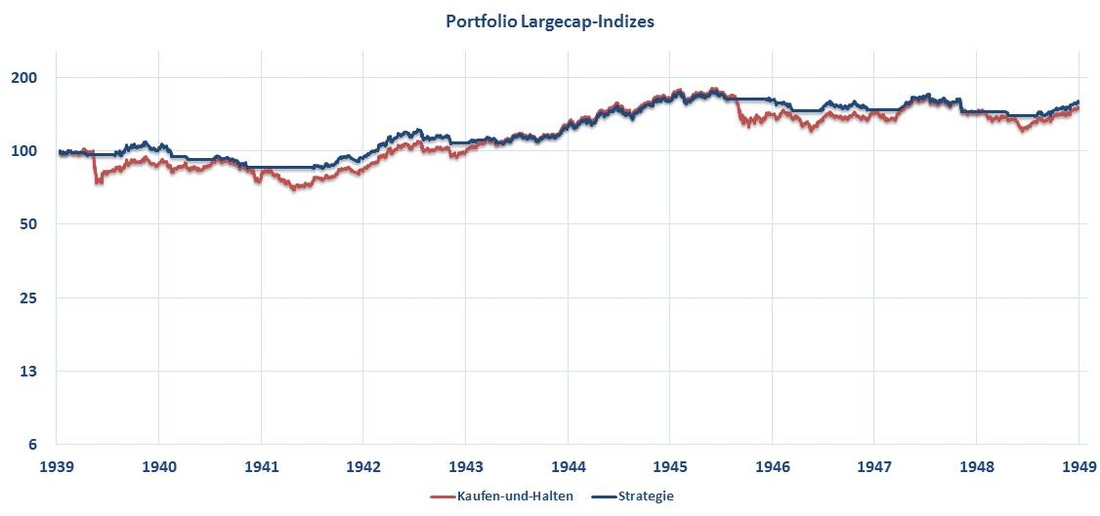
1939-1949 (Portfolio of large cap-indices)
Crash Protection-Strategy:
  • 4.7%, 22%   (annual return, maximum drawdown)
Buy-and-hold:
  • 4.1%, 33%   (annual return, maximum drawdown)

=> Winner on Risk and Return: Crash Protection
Picture
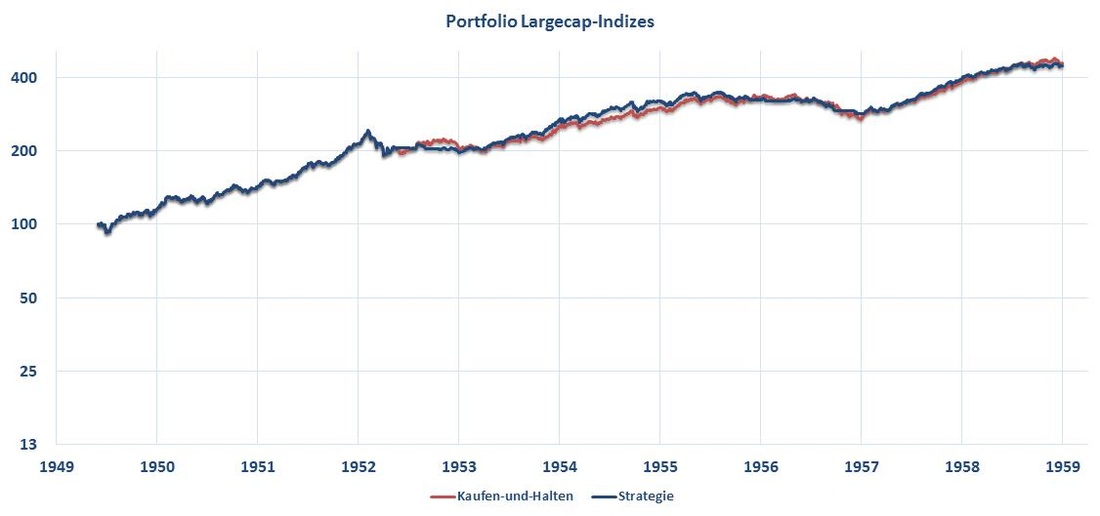
1949-1959 (Portfolio of large cap-indices)
Crash Protection-Strategy:
  • 16.9%, 21%   (annual return, maximum drawdown)
Buy-and-hold:
  • 17.2%, 21%   (annual return, maximum drawdown)

=> draw
Picture
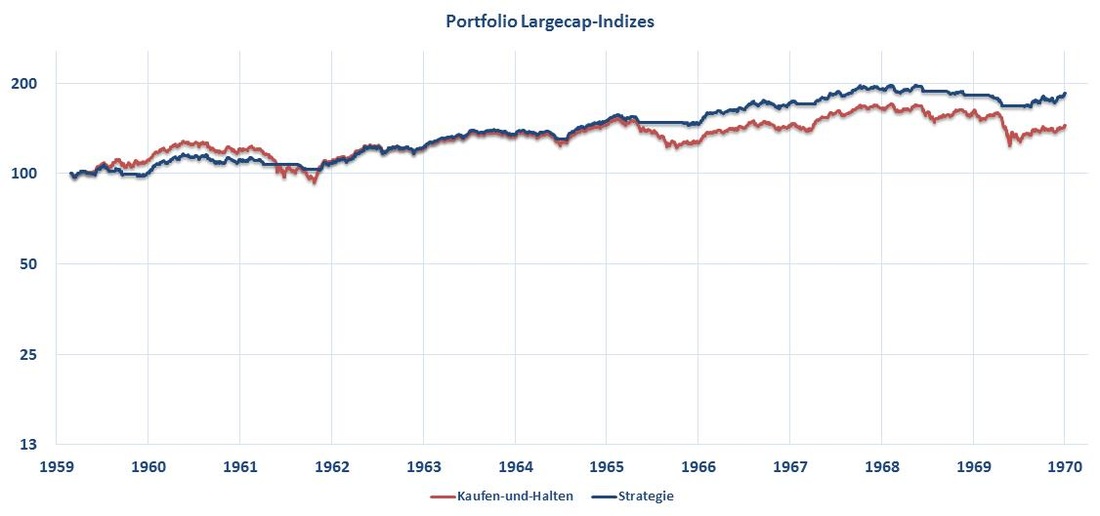
1959-1970 (Portfolio of large cap-indices)
Crash Protection-Strategy:
  • 5.8%, 16%   (annual return, maximum drawdown)
Buy-and-hold:
  • 3.4%, 28%   (annual return, maximum drawdown)

=> Winner on Risk and Return: Crash Protection
Picture
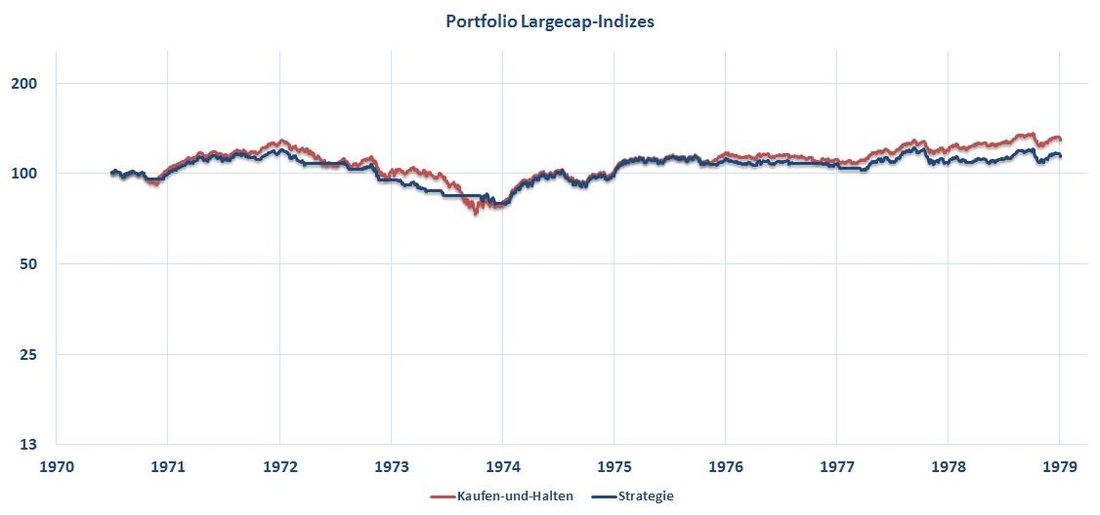
1970-1979 (Portfolio of large cap-indices)
Crash Protection-Strategy:
  • 1.7%, 34%   (annual return, maximum drawdown)
Buy-and-hold:
  • 3.2%, 43%   (annual return, maximum drawdown)

=> Winner on Risk-adjusted Return: Crash Protection
Picture
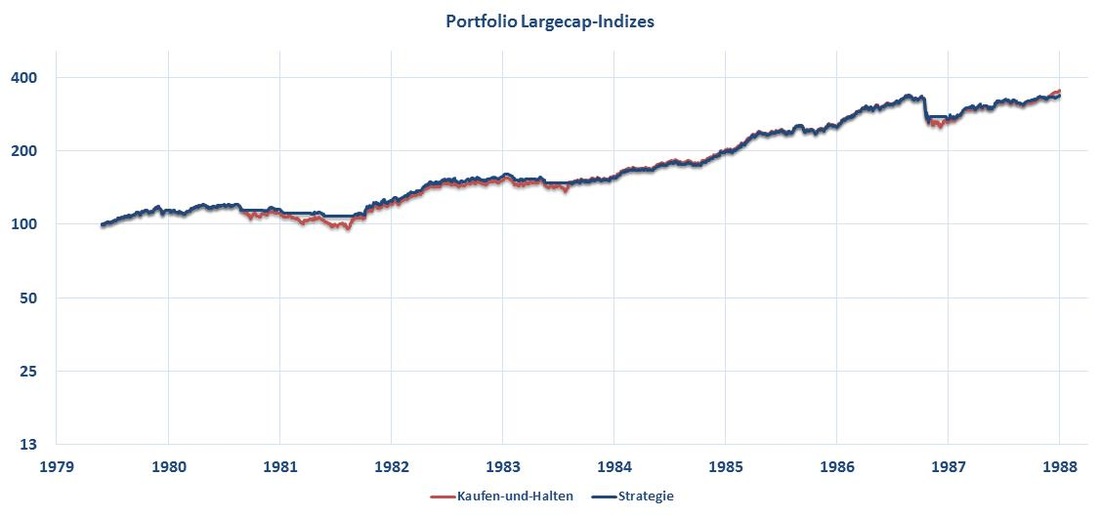
1979-1988 (Portfolio of large cap-indices)
Crash Protection-Strategy:
  • 15.2%, 23%   (annual return, maximum drawdown)
Buy-and-hold:
  • 15.9%, 26%   (annual return, maximum drawdown)

=> Winner on Risk-adjusted-Return: Crash Protection
Picture
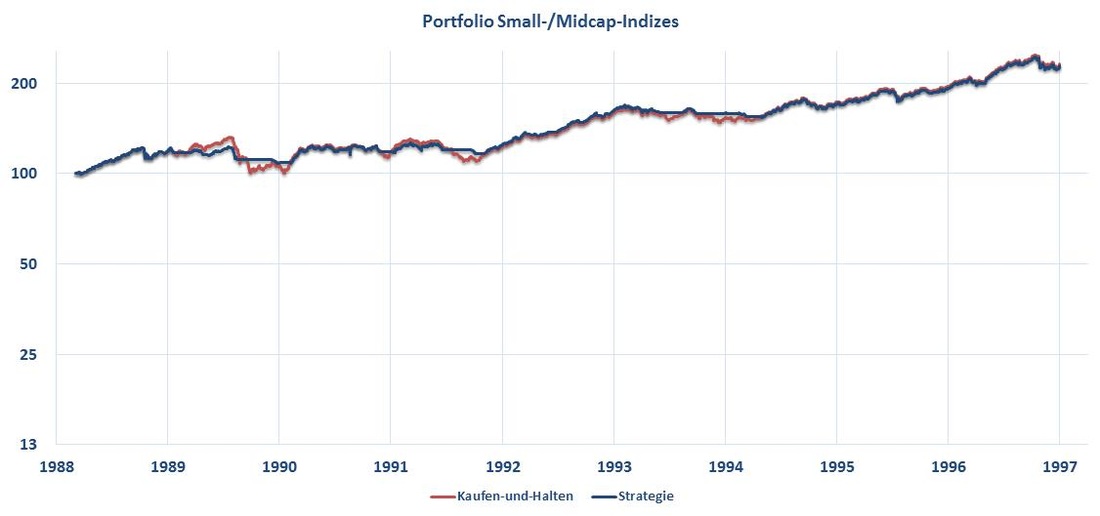
1988-1997 (Portfolio of small-/midcap-indices)
Crash Protection-Strategy:
  •   9.9%, 12%   (annual return, maximum drawdown)
Buy-and-hold:
  • 10.1%, 24%   (annual return, maximum drawdown)

=> Winner on Risk-adjusted Return: Crash Protection
Picture
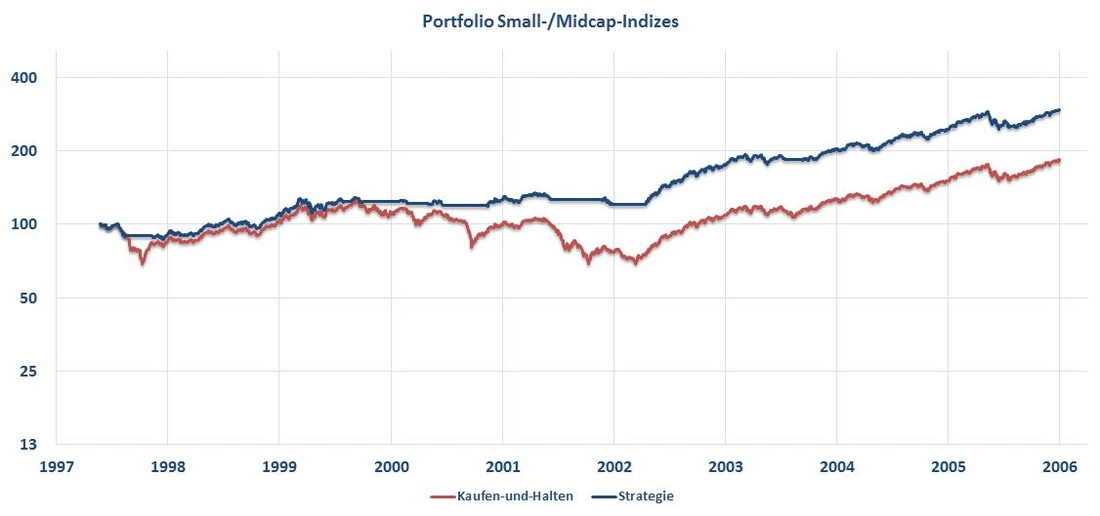
1997-2006 (Portfolio of small-/midcap indices)
Crash Protection-Strategy:
  • 13.4%, 15%   (annual return, maximum drawdown)
Buy-and-hold:
  •   7.3%, 45%   (annual return, maximum drawdown)

=> Winner on Risk and Return: Crash Protection
Picture
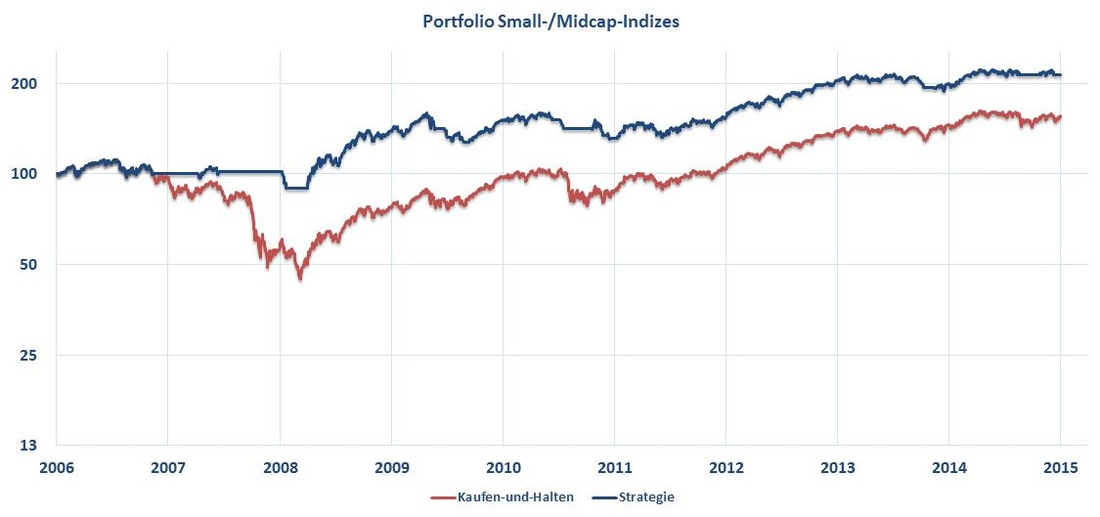
2006-2015 (Portfolio of small-/midcap indices)
Crash Protection-Strategy:
  • 8.8%, 20%   (annual return, maximum drawdown)
Buy-and-hold:
  • 5.1%, 60%   (annual return, maximum drawdown)

=> Winner on Risk and Return: Crash Protection
Picture

go to Live-Track Record
Content
contact@systinvest.com
ÜBER
systinvest.com | Investmentphilosophie
BLOG
CRASH WELTKARTE
CRASH PROTECTION
Letzter Stand | Philosophie | Crashphasen Charakteristika | Beispiele Marktrisiko | Backtests
WIKIFOLIOS
RATGEBER
TOOLS
LEGENDEN
ANALYSEN
​​Altersvorsorge | Anlagestrategien | Historische Vergleiche
KRYPTO
DISCLAIMER
DATENSCHUTZERKLÄRUNG
IMPRESSUM
Content
ABOUT
systinvest.com | Investment Philosophy
BLOG
CRASH WORLD MAP
CRASH PROTECTION
Latest Status | Philosophy | Crashperiod Characteristics | Examples Market Risk | Backtests
WIKIFOLIOS
GOOD TO KNOW
TOOLS
ANALYSES
Pension | Investment Strategies |Historical Backtests
CRYPTO
DISCLAIMER
DATENSCHUTZERKLÄRUNG
IMPRESSUM
  • Über
    • über Systinvest
    • Investmentphilosophie
  • Blog
  • Crash Weltkarte
  • Crash Protection
    • Letzter Stand
    • Philosophie
    • Crashphasen Charakteristika
    • Beispiele Marktrisiko
    • Backtests Crash Protection
  • wikifolios
    • Hebel +3faches Risikomanagement
    • Hebel Multistrategien
    • Marktzyklen offensiv gehebelt
    • Marktzyklen
    • Aktienwertselektion mit System
    • Alpha+Beta+Crash Risk Control
  • Ratgeber
    • Wie teuer sollte ein ETF oder Fonds sein?
    • Kann man mit Aktien reich werden?
    • Wie kann man sich vor Inflation schützen?
    • Crash am Aktienmarkt - Wieviel kann man verlieren?
    • Wie riskant sind Aktiensparpläne wirklich?
  • Tools
    • Sparplanrechner
    • Annuitätenrechner
  • Legenden
    • Warren Buffet
    • Edward O. Thorp
    • James Simons
    • "Pitbull" Marty Schwartz
    • Stanley Druckenmiller
  • Analysen
    • Altersvorsorge >
      • Inflation und Kaufkraftverlust
      • Inflationsschutz - Aktien oder Gold?
      • Generationen Altersvorsorge
      • Sparplanvergleich Aktien/Lebensversicherung >
        • Berechnungsannahmen
        • Ohne Steuerbetrachtung
        • Effekt Abgeltungssteuer
        • Effekt Inflation
    • Anlagestrategien >
      • Vola und Sharpe Ratio
      • Aktien mit Vola 2%
      • Momentum
    • Historische Vergleiche >
      • DAX 2016
      • DAX vs S&P 500
  • About
    • About systinvest
    • Investment philosophy
  • Blog
  • Crash World Map
  • Crash Protection
    • Latest Status
    • Philosophy
    • Crashperiod Characteristics
    • Examples Market Risk
    • Backtest Crash Protection
  • wikifolios
    • Leverage +3x Risk Management
    • Leverage Multistrategies
    • Marketcycles leveraged dynamically
    • Marketcycles
    • Systematic Stockpicking
    • Alpha + Beta + Crash Risk Control
  • Good to Know
    • How much should a fund cost?
    • Can you get rich with stocks?
    • How to protect against inflation?
    • Stock Market Crashs - How much can you lose?
    • Are stock saving plans really risky?
  • Tools
    • Savings Plan Calculator
    • Annuity Calculator
  • Analyses
    • Pension >
      • Inflation and Purchasing Power
      • Inflation protection - Stocks or Gold?
      • Cross-Generational Pension Plan
    • Investment Strategies >
      • Vola and Sharpe Ratio
      • Equity with 2% Vola
      • Momentum-en
    • Historical Backtests >
      • DAX 2016-en
      • S&P 500 vs DAX