S&P 500 vs. DAX - a true index comparison
Period 2005-2015
The widespread but useless comparison.
The widespread but useless comparison.
|
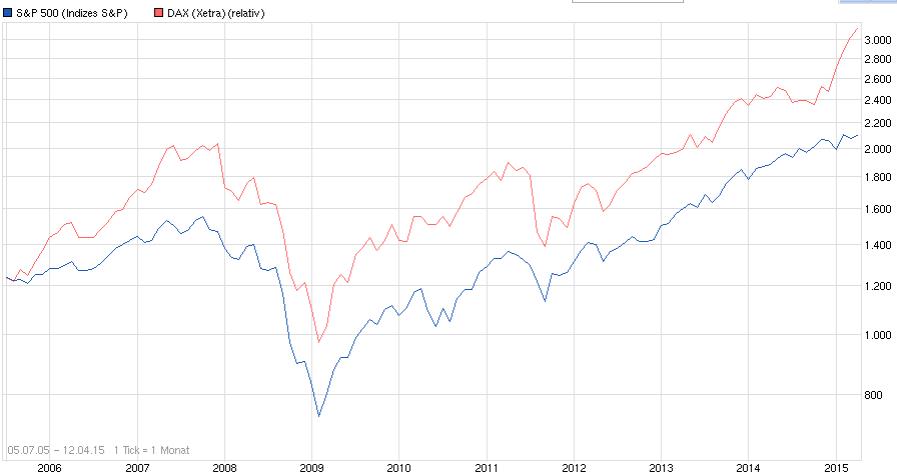
A chart comparison of two indices is done quickly. You can select an index on numerous stock exchange portals and quickly display a corresponding comparison in the chart. Whether on finanzen.net, finanztreff.de, onvista.de or ariva.de. If you compare the DAX, for example, with the S&P 500 from July 5, 2005, you get a picture like the following chart on ariva.de shows.
But what conclusion does this comparison allow? Has the DAX really performed better than the S&P 500? |
For simple chart comparisons of stock indices, three factors must be coordinated to make a meaningful comparison.
Actually self-evident and obvious factors that one would like to ignore in order to get a picture as quickly as possible. In the chart above, only one of these three factors is met, the period. Point 2 is not fulfilled, dividend income is included in the media reported DAX, while this is not the case in the media-wide S&P 500. Point 3 is also not fulfilled, the companies included in the DAX are valued in euros while the S&P 500 is a US dollar index.
- Are key figures and charts compared over the same period?
- Are dividend income taken into account equally in both indices?
- Are both indices viewed in the same currency?
Actually self-evident and obvious factors that one would like to ignore in order to get a picture as quickly as possible. In the chart above, only one of these three factors is met, the period. Point 2 is not fulfilled, dividend income is included in the media reported DAX, while this is not the case in the media-wide S&P 500. Point 3 is also not fulfilled, the companies included in the DAX are valued in euros while the S&P 500 is a US dollar index.
A meaningful comparison
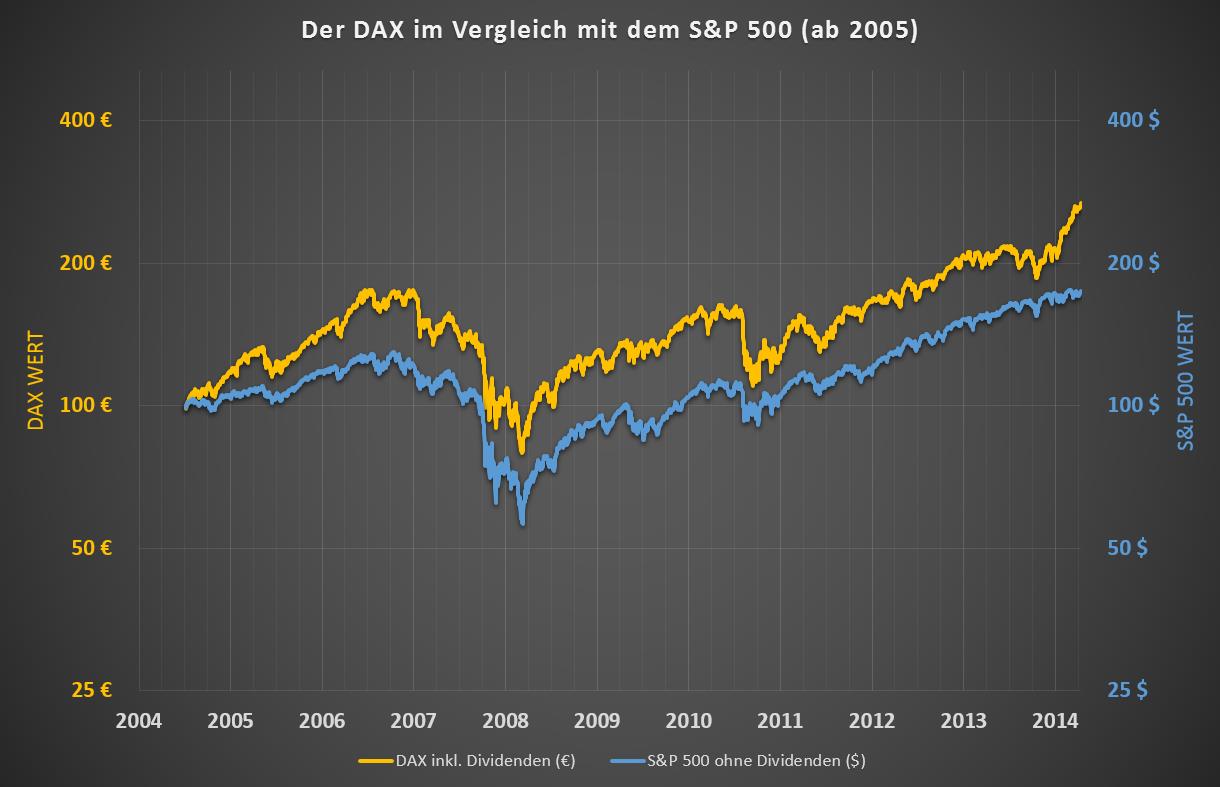
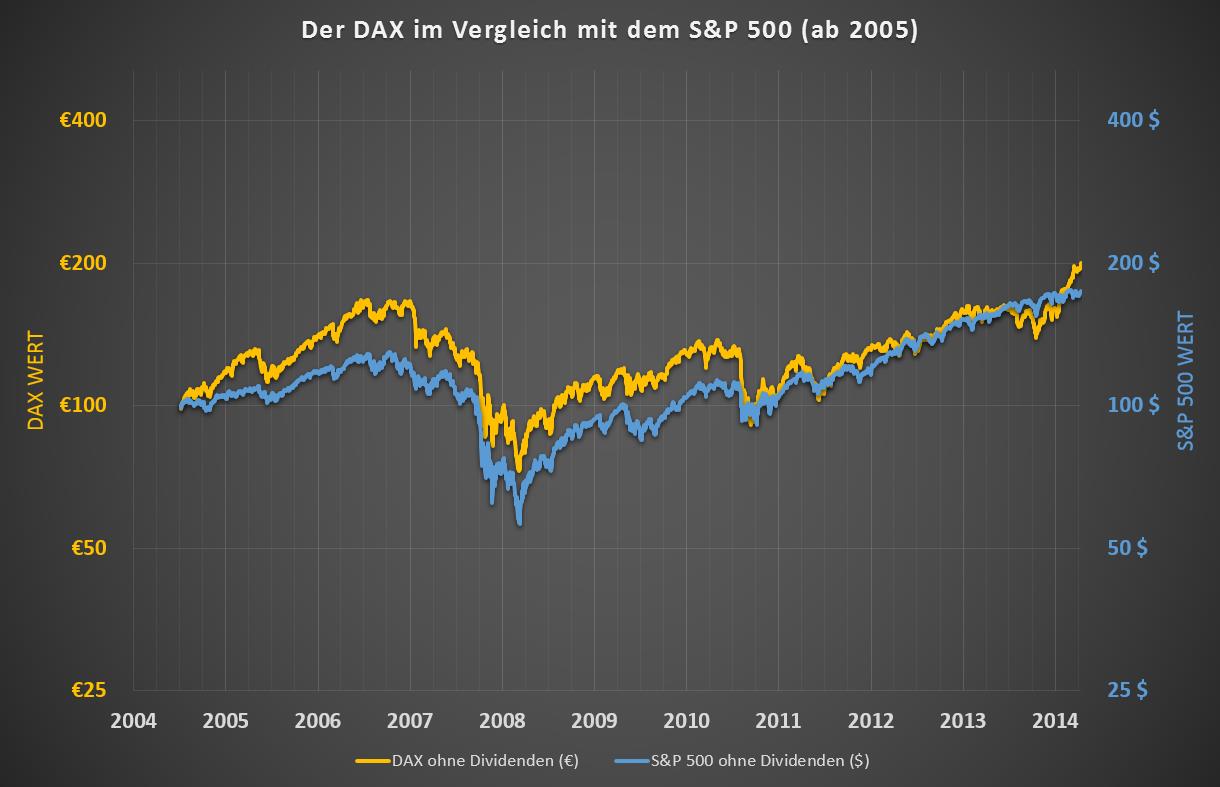
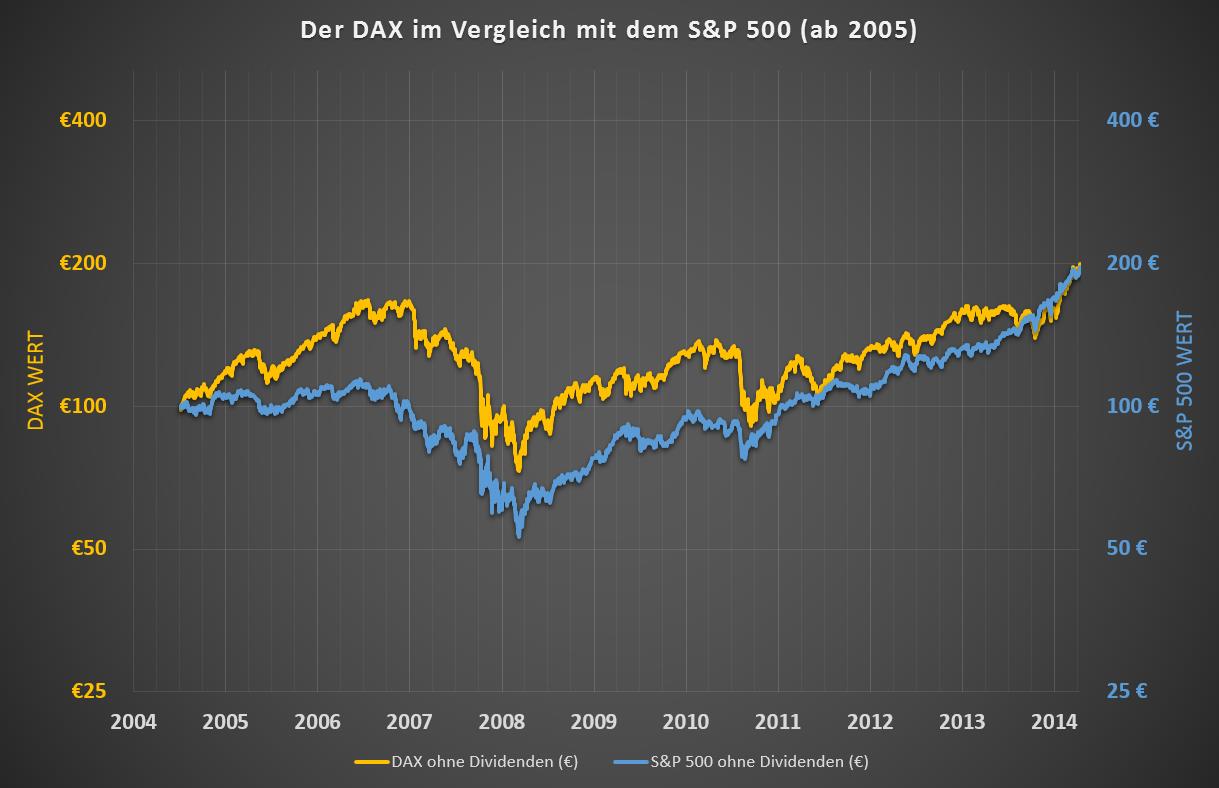
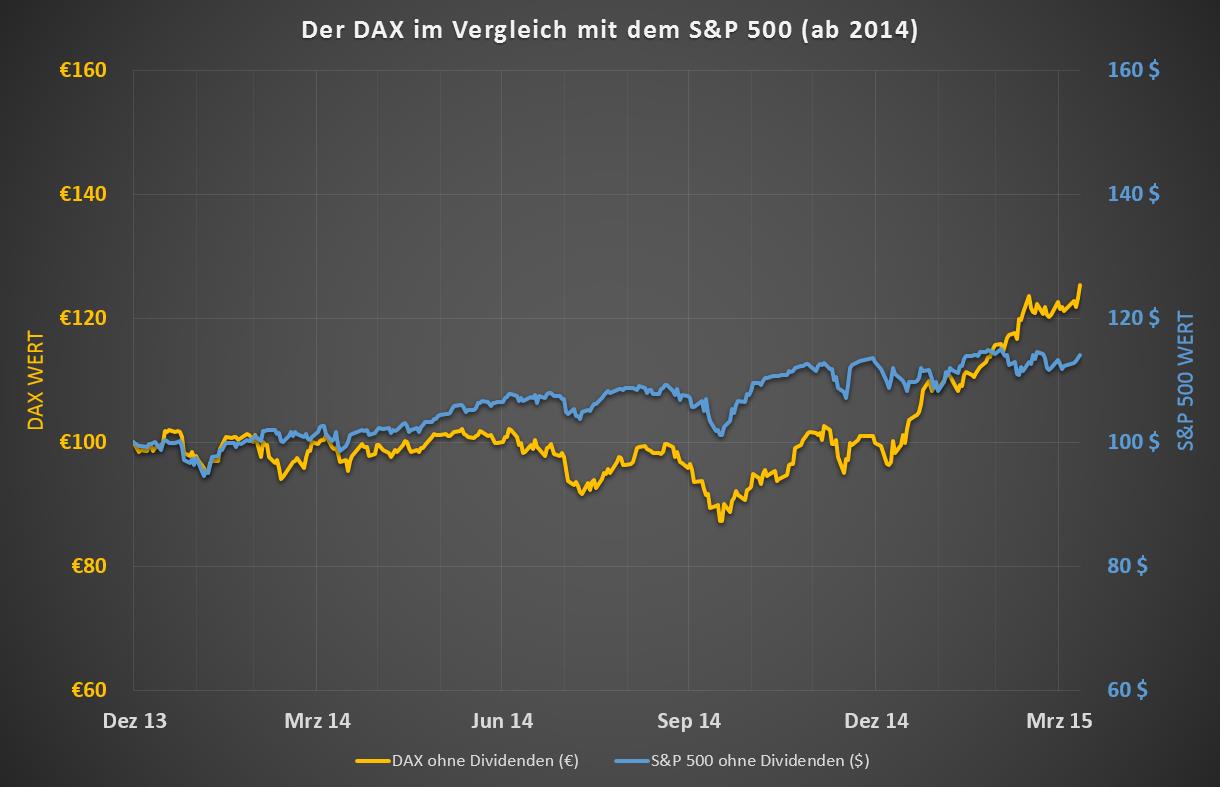
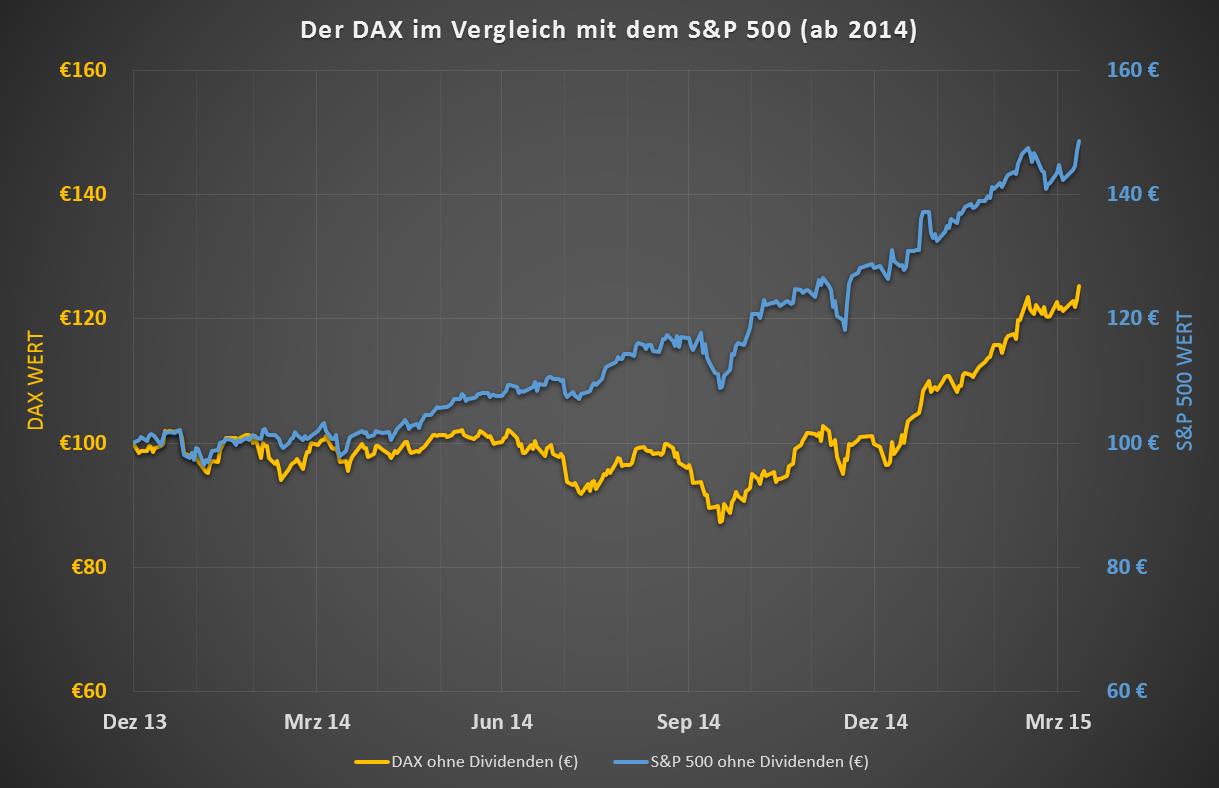
Do you come to a different result if you compare the index developments? The first of the following three charts shows the common but useless comparison of both indices. Then factor 2 is adjusted by using the DAX price index instead of the performance index *. In the third chart, the S&P 500 is finally converted to euros.
Do you come to a different result if you compare the index developments? The first of the following three charts shows the common but useless comparison of both indices. Then factor 2 is adjusted by using the DAX price index instead of the performance index *. In the third chart, the S&P 500 is finally converted to euros.
|
The supposedly better performance of the DAX evaporates when you ignore dividend income. If you also compare the currency, both indices achieved almost the same performance in the years 2005-2015.
Instead of the supposed 10.7% of the DAX versus a meager 5.9% of the S&P 500, both indices have achieved euro gains of just over 7% per year since 2005. In addition, there was between 3-4% dividend income per year. Further key figures can be found in the following table. |
Period 2014-2015
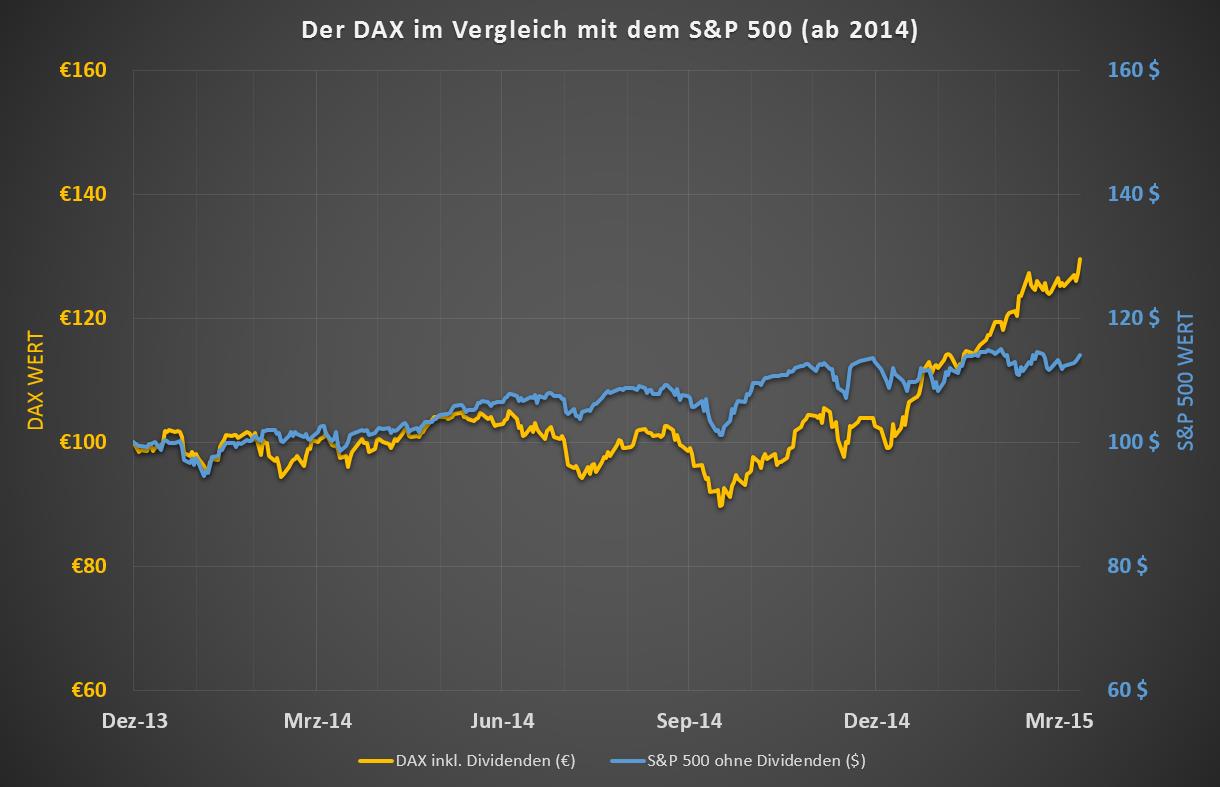
An investor gains an even more distorted picture if he wants to compare the two index developments since the beginning of 2014.
An investor gains an even more distorted picture if he wants to compare the two index developments since the beginning of 2014.
|
At first glance, the DAX seems to have been able to leave the S&P 500 behind since the beginning of 2014. According to the first chart, he significantly overcompensated for the sag in 2014. If you correct the different dividend view, the effect melts away slightly. The main distortion arises due to the different currencies. If you calculate the S&P 500 in euros as in the third chart, it left the DAX even more clearly behind in 2014 and the supposed sideways movement of the S&P 500 in 2015 converts into a rally comparable to that of the DAX.
Price gains of 22.5% of the DAX versus 10.9% of the S&P 500, when compared correctly, resulted in euro gains of only 19.3% of the DAX versus an impressive 36.3% of the S&P 500. |
Conclusion
If media comparisons of stock indices of different currencies and different consideration of dividends are made, one should keep in mind that such comparisons are meaningless. These representations should not be used to influence your personal investment decisions. It is best to get your own picture instead of relying on statements from the stock exchange media.
If media comparisons of stock indices of different currencies and different consideration of dividends are made, one should keep in mind that such comparisons are meaningless. These representations should not be used to influence your personal investment decisions. It is best to get your own picture instead of relying on statements from the stock exchange media.
* For a performance comparison it would have been advisable not to compare the DAX price index with the S&P 500 price index but the S&P 500 performance index with the DAX performance index. Because of the easier availability of the prices of the DAX price index, the opposite way was chosen. Since the dividend yield in both indices has not deviated much from one another at around 3-4% per year over the past few years, this does not significantly affect the performance comparison of the two indices.

