
Loss of Purchasing Power by Inflation
How much purchasing power is lost within 20 years with inflation rates from 1% to 20%?
The threat of inflation is back again and is making itself felt in supermarkets and retail trade more than it has been for a long time.
Basically, it feels like inflation hasn't been present for more than 20 years, in reality it was a constant companion. The low inflation rates of 1% to 3% per year hardly go unnoticed by consumers, while inflation rates of at least 8% as of September 2022 relentlessly demonstrate the devastating effect on purchasing power.
Who hasn't noticed by now that, as a result of the rising prices, there is less left in the wallet than a year ago?
The following chart shows how different inflation rates affect the loss of purchasing power over a 20-year period.
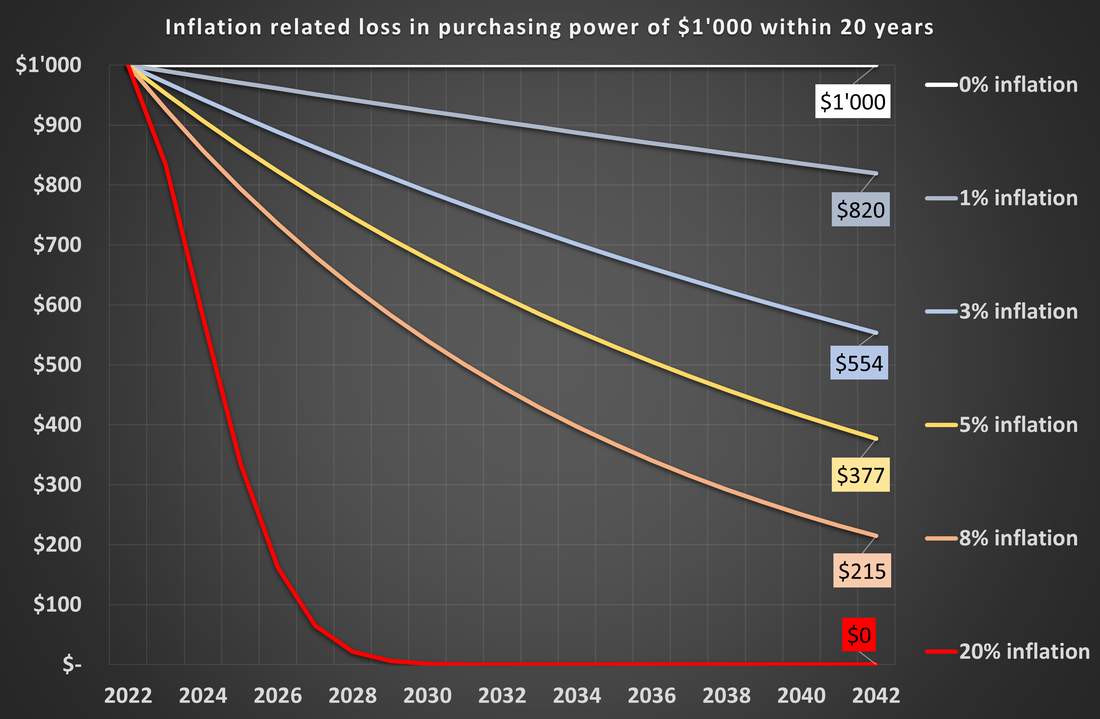
What will become of 1000 dollar in 2022 over the course of 20 years at different inflation rates?
A 1% inflation reduces the purchasing power quite continuously to about $820.
3% inflation will halve purchasing power by 2042.
With 5% inflation, in 2042 you can only buy goods worth around $377.
With 8% inflation, the loss of purchasing power is almost an unbelievable 80% within 20 years; purchasing power would be halved as early as 2030.
With 20% inflation, you can throw the $1,000 in the bin right away, and by 2028 they will be virtually worthless.
Conclusion
Forgotten for a long time, inflation is back on the scene in wealthy countries too. It was wrongly given little attention due to the recent low inflation rates.
Even with inflation of just 1%, this leads to a loss of purchasing power of almost 20% within 20 years. At 3% it's even 50%, and the current 8% inflation would wipe out as much as 80% of its value if it persisted over the next 20 years.
Investors must take inflation and the associated loss of purchasing power into account for their long-term decisions. If they don't do this, they should be aware of the danger of losing a large part of their savings in the course of their life. The loss will not be seen on paper, but based on what they can still buy with the amount in dollars which is then available.
Fortunately, there are ways to protect against inflation. One possibility is to invest more in real assets such as real estate, stocks or gold instead of nominal assets such as bonds or time deposits.
The following link provides an analysis comparing stocks and gold for their ability to protect against inflation since the 1890's.