
20-year saving plans with S&P 500 and DAX - are they really risky?
Wealth created out of 20-year saving plans in the S&P 500 since 1930
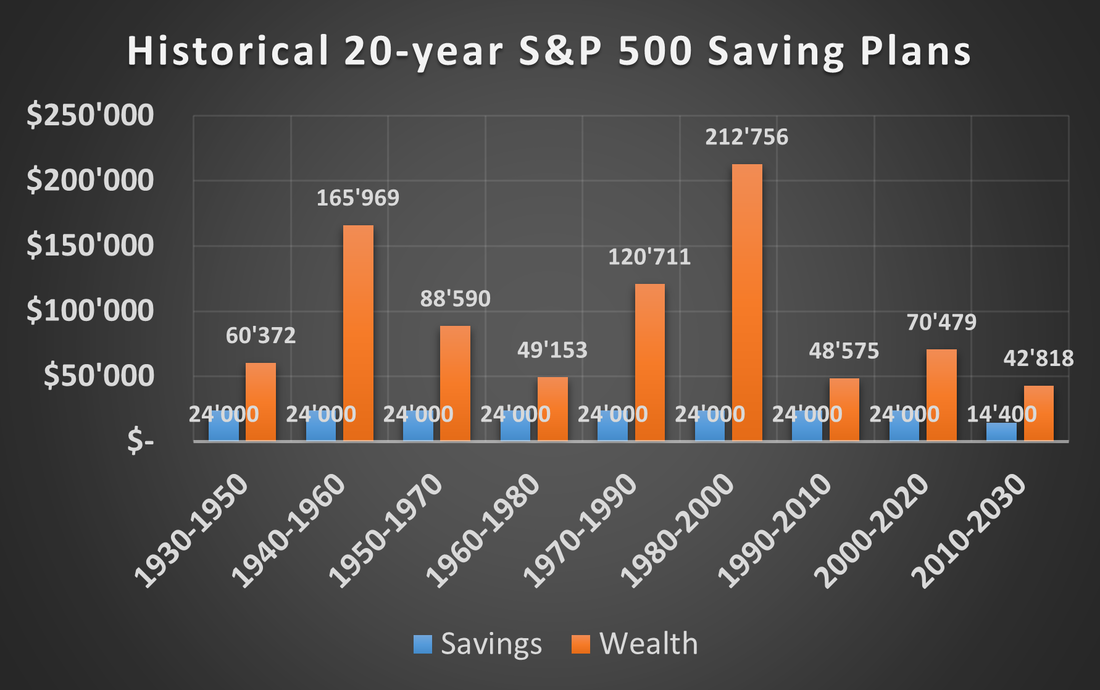
The following chart illustrates how much a 20-year saving plan of $1200 a year became worth in the periods from 1930 to 2021.
Annual management fees of 0.20% have been assumed. Nowadays, there are investment products with much less fees whereas during history higher fees of about 1.50% have been the usual case.
|
It is obvious that all 20-year saving plans ended in a profit. In the worst cases, like from 1960 until 1980 and 1990 until 2010, a stock investor could still double his savings throughout these periods.
The upper side is even more impressive, from 1940 to 1960 the stock investor would have achieved around $165'000 (7x savings) and from 1980 to 2000 even $212'000 (9x savings). On average, the savings amount could have been grown by a factor of 3 to 4. |
20-year saving plans in the German DAX index since 1960
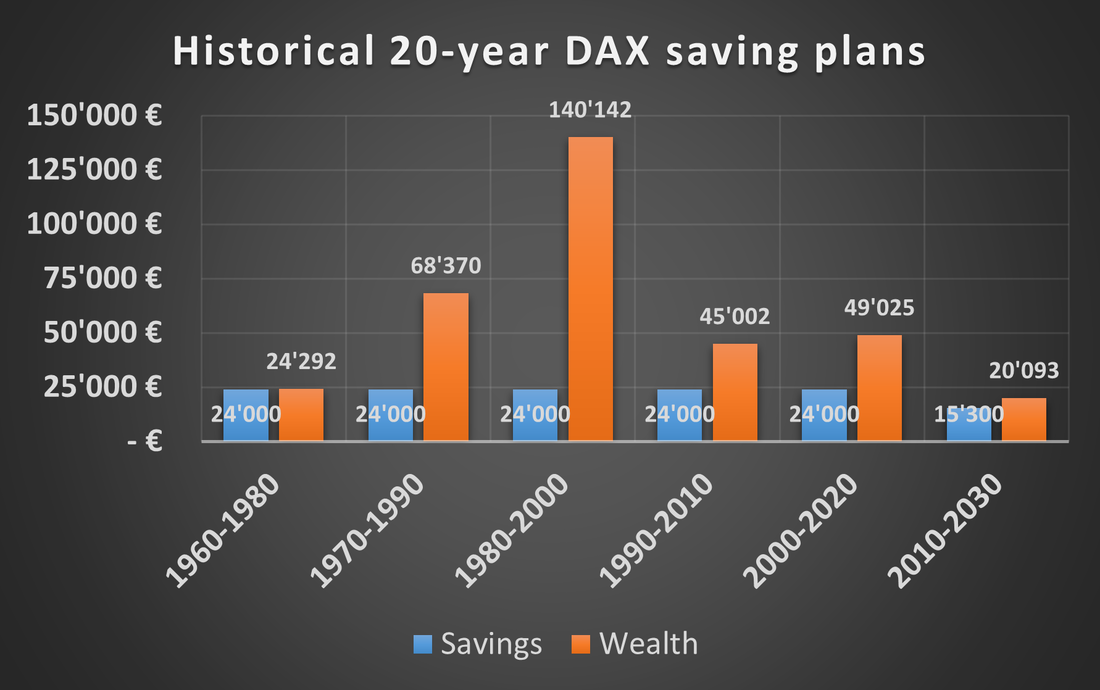
The following chart illustrates the same saving plans in the German DAX index, due to data availability starting in 1960.
The following chart illustrates the same saving plans in the German DAX index, due to data availability starting in 1960.
|
The results in the German index are not as good as the ones in the S&P 500. Nevertheless, also in this case a stock investor would never suffered a loss after a 20-year period. The worst scenario happened from 1960 to 1980, where the investor would have got his savings amount back.
The best scenario happened synchroneously with the one from the S&P 500, from 1980 to 2000 where the stock investor grow his 24'000 EUR up to 140'000 EUR. On average, after 20 years an investor doubled the savings. |
Conclusion
Over long investment horizons of 20 years, stock saving plans in the S&P 500 or DAX are not really as risky as they might appear at first glance. Not in any 20-year period a stock investor would have suffered a loss of his savings at the end. The worst case-scenario for the DAX investor happened from 1960 to 1980 when he just got his money back. In the worst case of the S&P 500 investor, he would still have doubled his saving amount.
On average, the saving amounts could have been grown impressively. Twice as much with the DAX and even 3x to 4x as much with the S&P 500. After 20 years of strong markets from 1980 to 2000, both saving plans delivered astonishing results with 140'000 EUR out from the DAX- and $212'000 out from the S&P-plan
With respect to wealth creation for pension purposes and given the a long term investment horizon of at least 20 years, saving plans in stock market indices should be definitely considered. The fear of short-term risks should not distract investors from the long-term opportunities of equities and the far less risks over these periods. Keeping savings "safe" in bank deposits or even in a physical safe may look less risky in the short-term, but in reality such strategies turn out much more risky in the long run. Even though the notional amount of these savings will for sure not lose, the money itself will lose value due to inflation.
One of the best strategies to create wealth in the long run is to invest a significant portion of the portfolio in the stock market.