SYSTINVEST
  • Über
    • über Systinvest
    • Investmentphilosophie
  • Blog
  • Crash Weltkarte
  • Crash Protection
    • Letzter Stand
    • Philosophie
    • Crashphasen Charakteristika
    • Beispiele Marktrisiko
    • Backtests Crash Protection
  • wikifolios
    • Hebel +3faches Risikomanagement
    • Hebel Multistrategien
    • Marktzyklen offensiv gehebelt
    • Marktzyklen
    • Aktienwertselektion mit System
    • Alpha+Beta+Crash Risk Control
  • Ratgeber
    • Wie teuer sollte ein ETF oder Fonds sein?
    • Kann man mit Aktien reich werden?
    • Wie kann man sich vor Inflation schützen?
    • Crash am Aktienmarkt - Wieviel kann man verlieren?
    • Wie riskant sind Aktiensparpläne wirklich?
  • Tools
    • Sparplanrechner
    • Annuitätenrechner
  • Legenden
    • Warren Buffet
    • Edward O. Thorp
    • James Simons
    • "Pitbull" Marty Schwartz
    • Stanley Druckenmiller
  • Analysen
    • Altersvorsorge >
      • Inflation und Kaufkraftverlust
      • Inflationsschutz - Aktien oder Gold?
      • Generationen Altersvorsorge
      • Sparplanvergleich Aktien/Lebensversicherung >
        • Berechnungsannahmen
        • Ohne Steuerbetrachtung
        • Effekt Abgeltungssteuer
        • Effekt Inflation
    • Anlagestrategien >
      • Vola und Sharpe Ratio
      • Aktien mit Vola 2%
      • Momentum
    • Historische Vergleiche >
      • DAX 2016
      • DAX vs S&P 500
  • About
    • About systinvest
    • Investment philosophy
  • Blog
  • Crash World Map
  • Crash Protection
    • Latest Status
    • Philosophy
    • Crashperiod Characteristics
    • Examples Market Risk
    • Backtest Crash Protection
  • wikifolios
    • Leverage +3x Risk Management
    • Leverage Multistrategies
    • Marketcycles leveraged dynamically
    • Marketcycles
    • Systematic Stockpicking
    • Alpha + Beta + Crash Risk Control
  • Good to Know
    • How much should a fund cost?
    • Can you get rich with stocks?
    • How to protect against inflation?
    • Stock Market Crashs - How much can you lose?
    • Are stock saving plans really risky?
  • Tools
    • Savings Plan Calculator
    • Annuity Calculator
  • Analyses
    • Pension >
      • Inflation and Purchasing Power
      • Inflation protection - Stocks or Gold?
      • Cross-Generational Pension Plan
    • Investment Strategies >
      • Vola and Sharpe Ratio
      • Equity with 2% Vola
      • Momentum-en
    • Historical Backtests >
      • DAX 2016-en
      • S&P 500 vs DAX

Analyses

Volatility and Sharpe Ratio are inadequate financial measures

7/7/2019

0 Comments

 
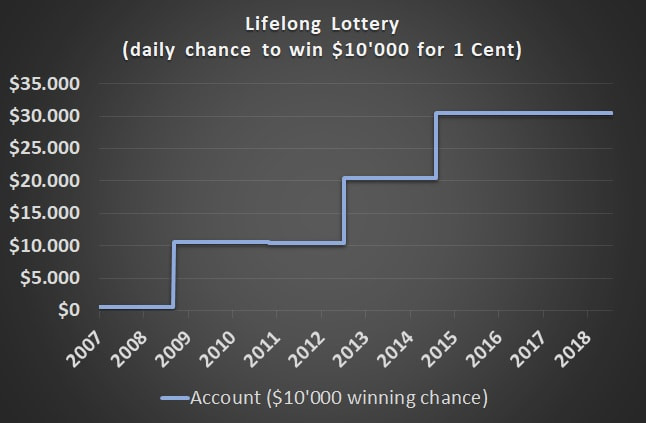
Example 1:   daily lottery prized at $10'000
Imagine someone would offer you the following lottery.
  • You have to put $500 in an account only once in your life.
  • Every day $0,01 (1 Cent) will be deducted from your account.
  • Every day you have 1:1000 chance to win $10'000.

This lottery has a minimum duration of 136 years (50'000 days). Therefore you will get a daily chance to win $10'000 on every day of your life for a single investment of only $500.
Would you accept this offer?
Picture
Picture
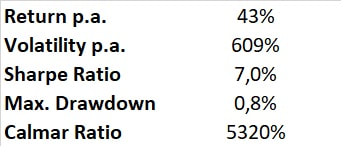
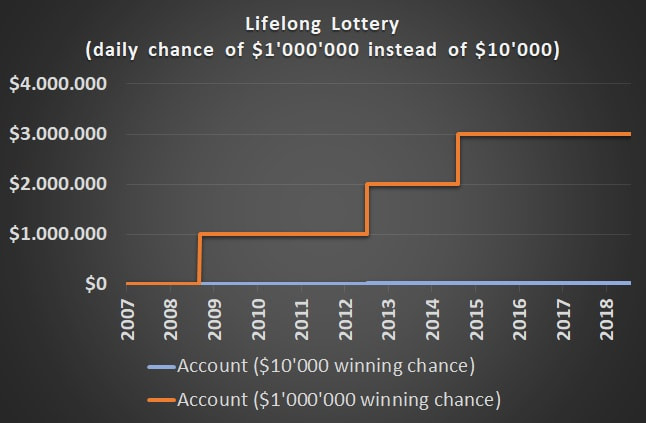
This charts illustrates how your account would have evolved during time. In regular frequency it would have increased in value by $10'000 since having a 1:1000 winning probability means that one wins every three years on average.
The metrics looks not as good as the chart, as long as you focus on volatility and sharpe ratio. During this 12 year period this strategy would have returned 43% p.a. while the volatility would have skyrocketed to 609%. Therefore the Sharpe Ratio with 7% is low compared to traditional asset classes like equity or bonds.
On the other hand, the Max. Drawdown is very low with a value of 0.8%. This leads to a sensational high Calmar Ratio of 5320% which is far beyond what traditional asset classes can deliver.

Example 2:   Who wants to be a millionaire?
Sure, the volatility looks very bad in the example above. One could criticize that this example is just designed to make the volatility look bad. On the one hand, yes this example is designed. On the other hand, all strategies with a cash flow structure comparable to an insurance product have a pay off structure like the one from the example above. The volatility punishes strategy which allow for pay offs far beyond the average return, and what makes it worse - the volatility punishes beyond average surpluses exactly the same way as it punishes losses.

The upcoming example will show once and for all that volatility is an inadequate risk measure:
Now, a new lottery is offered to you which is exactly the same as the lottery you have just seen, except one thing: instead of having a daily chance to win $10'000 now you can win $1'000'000.

  • You have to put $500 in an account only once in your life.
  • Every day $0,01 (1 Cent) will be deducted from your account.
  • Every day you have 1:1000 chance to win $1'000'000.
Picture
Picture
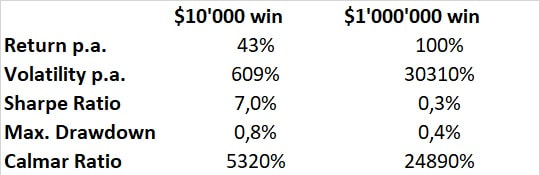
The volatility in the $1'000'000-lottery reaches a crazy 30310% compared to 609% before. The Sharpe Ratio diminishes to 0.3% from 7.0% in example 1.
An investor whose investment decisions are based on volatility and Sharpe Ratio would choose the $10'000-lottery over the $1'000'000. The Sharpe Ratio-investor does not want to be a millionaire.
It should be obvious to everyone that the right decision is to choose the $1'000'000-lottery. In contrast, the risk metric Max. Drawdown and the Calmar Ratio would lead an investor to make a reasonable decision.
Conclusion
Volatility as a risk measure is punishing deviations from a long-term average. It does not distinguish whether these deviations come from huge losses or huge profits. As a consequence all investment strategies which have an insurance-like pay-off are rated bad by the volatility.
In contrast, the Max. Drawdown is capable of measuring such strategies adequately. This is the reason, why I use the Max. Drawdown in all my strategy analysis tools to find successful systematic investment strategies.
0 Comments

How to be fully invested in equities with less than 2% volatility

1/21/2017

1 Comment

 
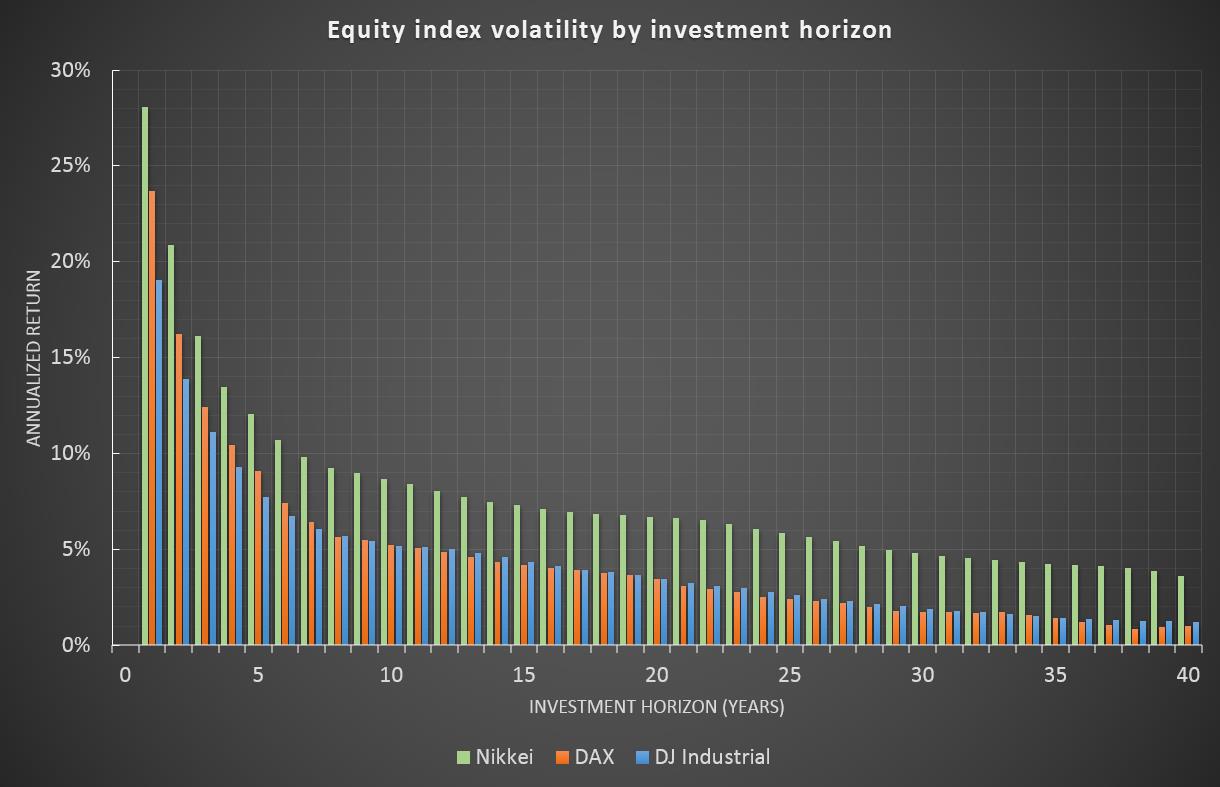
Abstract
Is there a way to invest in the equity market with a realized volatility of less than 2%? What sounds impossible from a first point of view has contrarily to be considered common knowledge. Though, the underlying relation has not often been stated in a formal way.
It is as simple as this, look at your investment horizon. Equities are said to have a volatility of around 20%. This is a misleading information since the risk measure volatility does not consider the investment horizon of an investor or a specific strategy.
An investor who is planning to redeem his money after one year could consider the volatility on his return to be around 20%. On the other hand, a 30-year old investor planning to save for his pension would overestimate the risks in his equity investment if he would not count for the long holding period.
In this analysis, the impact of the investment horizon on the volatility and return of an equity investment is revealed.
Setup
For this analysis three different equity markets will be covered. To cover different global regions, one index is picked to reflect the regions USA, Europe and Asia.
a. Dow Jones Industrial Average Price Index (1929-2016) (ex dividends)
b. German DAX Total Return Index (1959-2016) (inclusive dividends)
c. Japanese Nikkei Price Index (1949-2016) (ex dividends)
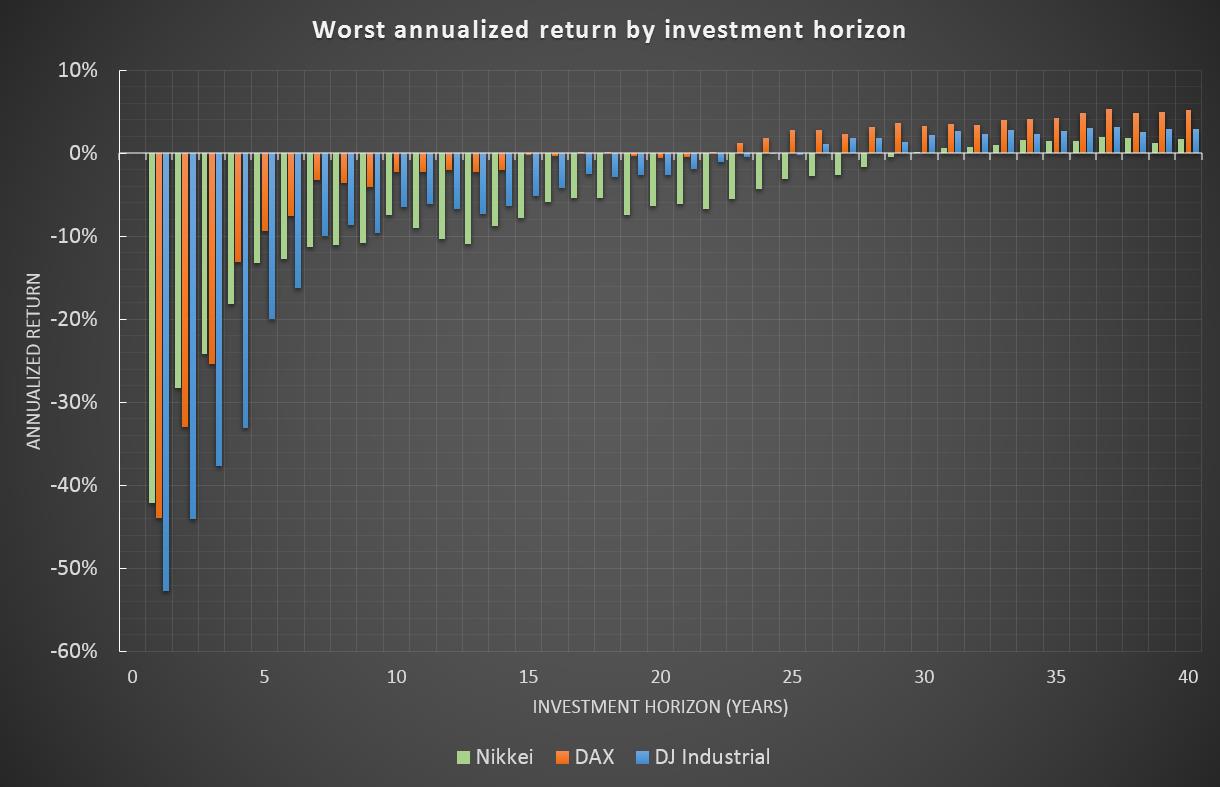
Investment horizon on volatility
The volatility chart shows clearly that the volatility of annualized equity index returns is falling for each of the indices. An investor with an investment horizon of 30 years will face volatilities of less than 5% for each of the indices, Nikkei slightly below 5% while DJI and DAX would be even below 2%.
Remark:
Assuming a normal distribution of equity returns, volatility falls by the rate  "1 divided by
square root of investment horizon".
(This means 4-year volatility is half as much as the 1-year volatility, 9-year volatility is one third, etc.).

Picture
Investment horizon on worst return
Volatility is one side of the coin, but even more important is the worst return an investor had faced during his investment horizon. These figures could be understood as the annualized return of an investor who entered the market in the worst time imaginable, e.g. immediately before the Great Depression started in 1929 or at the height of the 1990s Tech Bubble.
As for the volatility, this risk is also declining with increasing investment horizons. An investor with an investment horizon of 30 years or more would not have faced a loss on his investment for each of the indices.
Picture
Conclusion
What consequence should be derived from these results?
An investor has to be very careful in applying risk measures. Standard measures like volatility are not reflecting the investment horizon of an investor. Consequence might be, that the risk appetite is underestimated which would lead to a higher weight of cash or bonds. This allocation, which would normally be considered as a more "risk averse" one, might turn out to be a strategy which in fact increases a more severe but hidden risk for longer investment periods - inflation.
Therefore, in all circumstances, investors should always account for their investment horizon. In case of volatility this could be done not only with using a qualitative approach to increase the equity weight for longer horizons by a rule of thumb but with taking into account loss taking capability on a given investment horizon adjusted on a base of x-years-volatility.
1 Comment

Momentum - Do stocks have a memory?

12/20/2015

0 Comments


Momentum - Do stocks have a memory?

What is Momentum?

Following common academic assumptions on stock market returns they do not have a memory. That means, that stock market returns of tomorrow are completely indepedent of today's return. One could say that a market does not remember what has happened before. On each day, the dice market return seems to be thrown freshly.
Practitioners on the other hand do talk a lot about a strategy called Momentum. Though there is a wide range of how Momentum can be defined precisely, all such strategies share the assumption that markets tend to build market trends. If that is true, markets would indeed have a memory since a good past performance could be an indication of ongoing future benefits.

Who is right - the academics or the practitioners?

Used data and test setup

In order to test the Momentum effect the following setup has been applied:
  1. Historical monthly returns of stock market indices (S&P 500, DAX, Stoxx 600, Nikkei 225, MSCI World) (source investing.com)
  2. Available history of the data differs for the indices. While DAX reaches back until 1988 the others start between 2002 and 2005.
  3. Mainly total return indices have been used with one exception (MSCI World).
  4. Theoretical returns are based on an assumed normal distribution of market returns. Mean and volatility have been estimated from historical data.
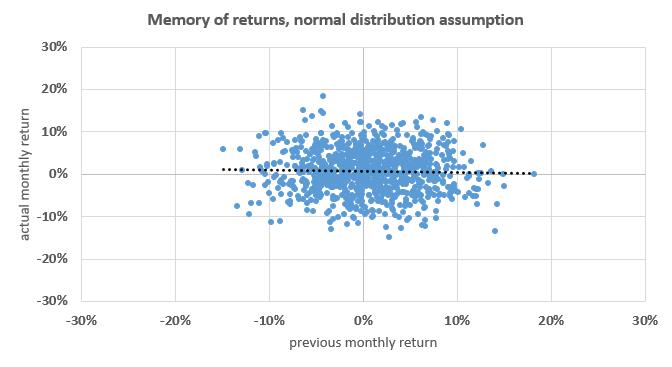
Theoretical returns (=no memory)

Chart und statistical data, based on an assumed normal distribution.
Picture
Picture
Following the theory stock markets do not have a memory.
How can one come to this conclusion?
  1. The point cloud does not show any trend and the dotted regression line is flat.
  2. The p-value of the statistics is quite high (34%). This means that the statistics might be coincidental with quite high probability.
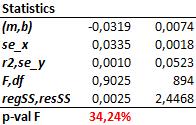
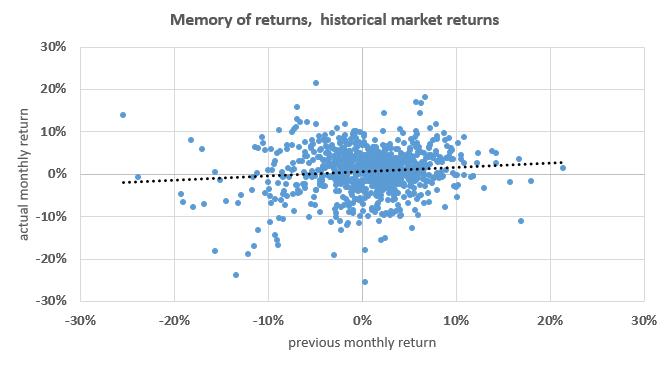
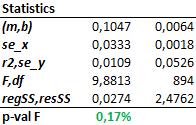
Historical returns

How do chart and statistics look like for the real historical market data?
Picture
Picture
The real market return history shows that stock markets might have a memory.
How can one come to this conclusion?
  1. The point cloud shows a trend despite being dispersed. The corresponding regression line has a positive slope which means that higher actual returns could be indicative for higher future returns.
  2. The p-value of the statistics is quite low (0.17%). This means that the probability that these results occured by coincidence is quite low.
Conclusion

According to real market data the normal distribution assumption has to be withdrawn (and consequently all market theories which are based on it). Beyond that this test setup verified the existence of the Momentum effect.
Side note
In addition to the Momentum effect a comparison of both charts illustrates another attrbiute of real market returns compared to their theoretical assumption. The dispersion  of the real returns is obviously wider than the one of the theorietical returns, especially for very high market losses. Consequently, an investor who applies risk models based on a normal distribution assumption might underestimate the risk of very high losses.

0 Comments

    Author

    Bertan Gueler, CFA

    Archives

    July 2019
    January 2017
    December 2015

    Categories

    All
    Alpha Strategies
    Investment Strategies
    Risk Management

    RSS Feed

Content
contact@systinvest.com
ÜBER
systinvest.com | Investmentphilosophie
BLOG
CRASH WELTKARTE
CRASH PROTECTION
Letzter Stand | Philosophie | Crashphasen Charakteristika | Beispiele Marktrisiko | Backtests
WIKIFOLIOS
RATGEBER
TOOLS
LEGENDEN
ANALYSEN
​​Altersvorsorge | Anlagestrategien | Historische Vergleiche
KRYPTO
DISCLAIMER
DATENSCHUTZERKLÄRUNG
IMPRESSUM
Content
ABOUT
systinvest.com | Investment Philosophy
BLOG
CRASH WORLD MAP
CRASH PROTECTION
Latest Status | Philosophy | Crashperiod Characteristics | Examples Market Risk | Backtests
WIKIFOLIOS
GOOD TO KNOW
TOOLS
ANALYSES
Pension | Investment Strategies |Historical Backtests
CRYPTO
DISCLAIMER
DATENSCHUTZERKLÄRUNG
IMPRESSUM
  • Über
    • über Systinvest
    • Investmentphilosophie
  • Blog
  • Crash Weltkarte
  • Crash Protection
    • Letzter Stand
    • Philosophie
    • Crashphasen Charakteristika
    • Beispiele Marktrisiko
    • Backtests Crash Protection
  • wikifolios
    • Hebel +3faches Risikomanagement
    • Hebel Multistrategien
    • Marktzyklen offensiv gehebelt
    • Marktzyklen
    • Aktienwertselektion mit System
    • Alpha+Beta+Crash Risk Control
  • Ratgeber
    • Wie teuer sollte ein ETF oder Fonds sein?
    • Kann man mit Aktien reich werden?
    • Wie kann man sich vor Inflation schützen?
    • Crash am Aktienmarkt - Wieviel kann man verlieren?
    • Wie riskant sind Aktiensparpläne wirklich?
  • Tools
    • Sparplanrechner
    • Annuitätenrechner
  • Legenden
    • Warren Buffet
    • Edward O. Thorp
    • James Simons
    • "Pitbull" Marty Schwartz
    • Stanley Druckenmiller
  • Analysen
    • Altersvorsorge >
      • Inflation und Kaufkraftverlust
      • Inflationsschutz - Aktien oder Gold?
      • Generationen Altersvorsorge
      • Sparplanvergleich Aktien/Lebensversicherung >
        • Berechnungsannahmen
        • Ohne Steuerbetrachtung
        • Effekt Abgeltungssteuer
        • Effekt Inflation
    • Anlagestrategien >
      • Vola und Sharpe Ratio
      • Aktien mit Vola 2%
      • Momentum
    • Historische Vergleiche >
      • DAX 2016
      • DAX vs S&P 500
  • About
    • About systinvest
    • Investment philosophy
  • Blog
  • Crash World Map
  • Crash Protection
    • Latest Status
    • Philosophy
    • Crashperiod Characteristics
    • Examples Market Risk
    • Backtest Crash Protection
  • wikifolios
    • Leverage +3x Risk Management
    • Leverage Multistrategies
    • Marketcycles leveraged dynamically
    • Marketcycles
    • Systematic Stockpicking
    • Alpha + Beta + Crash Risk Control
  • Good to Know
    • How much should a fund cost?
    • Can you get rich with stocks?
    • How to protect against inflation?
    • Stock Market Crashs - How much can you lose?
    • Are stock saving plans really risky?
  • Tools
    • Savings Plan Calculator
    • Annuity Calculator
  • Analyses
    • Pension >
      • Inflation and Purchasing Power
      • Inflation protection - Stocks or Gold?
      • Cross-Generational Pension Plan
    • Investment Strategies >
      • Vola and Sharpe Ratio
      • Equity with 2% Vola
      • Momentum-en
    • Historical Backtests >
      • DAX 2016-en
      • S&P 500 vs DAX