SYSTINVEST
  • Über
    • über Systinvest
    • Investmentphilosophie
  • Blog
  • Crash Weltkarte
  • Crash Protection
    • Letzter Stand
    • Philosophie
    • Crashphasen Charakteristika
    • Beispiele Marktrisiko
    • Backtests Crash Protection
  • wikifolios
    • Hebel +3faches Risikomanagement
    • Hebel Multistrategien
    • Marktzyklen offensiv gehebelt
    • Marktzyklen
    • Aktienwertselektion mit System
    • Alpha+Beta+Crash Risk Control
  • Ratgeber
    • Wie teuer sollte ein ETF oder Fonds sein?
    • Kann man mit Aktien reich werden?
    • Wie kann man sich vor Inflation schützen?
    • Crash am Aktienmarkt - Wieviel kann man verlieren?
    • Wie riskant sind Aktiensparpläne wirklich?
  • Tools
    • Sparplanrechner
    • Annuitätenrechner
  • Legenden
    • Warren Buffet
    • Edward O. Thorp
    • James Simons
    • "Pitbull" Marty Schwartz
    • Stanley Druckenmiller
  • Analysen
    • Altersvorsorge >
      • Inflation und Kaufkraftverlust
      • Inflationsschutz - Aktien oder Gold?
      • Generationen Altersvorsorge
      • Sparplanvergleich Aktien/Lebensversicherung >
        • Berechnungsannahmen
        • Ohne Steuerbetrachtung
        • Effekt Abgeltungssteuer
        • Effekt Inflation
    • Anlagestrategien >
      • Vola und Sharpe Ratio
      • Aktien mit Vola 2%
      • Momentum
    • Historische Vergleiche >
      • DAX 2016
      • DAX vs S&P 500
  • About
    • About systinvest
    • Investment philosophy
  • Blog
  • Crash World Map
  • Crash Protection
    • Latest Status
    • Philosophy
    • Crashperiod Characteristics
    • Examples Market Risk
    • Backtest Crash Protection
  • wikifolios
    • Leverage +3x Risk Management
    • Leverage Multistrategies
    • Marketcycles leveraged dynamically
    • Marketcycles
    • Systematic Stockpicking
    • Alpha + Beta + Crash Risk Control
  • Good to Know
    • How much should a fund cost?
    • Can you get rich with stocks?
    • How to protect against inflation?
    • Stock Market Crashs - How much can you lose?
    • Are stock saving plans really risky?
  • Tools
    • Savings Plan Calculator
    • Annuity Calculator
  • Analyses
    • Pension >
      • Inflation and Purchasing Power
      • Inflation protection - Stocks or Gold?
      • Cross-Generational Pension Plan
    • Investment Strategies >
      • Vola and Sharpe Ratio
      • Equity with 2% Vola
      • Momentum-en
    • Historical Backtests >
      • DAX 2016-en
      • S&P 500 vs DAX

Analyses

Volatility and Sharpe Ratio are inadequate financial measures

7/7/2019

0 Comments

 
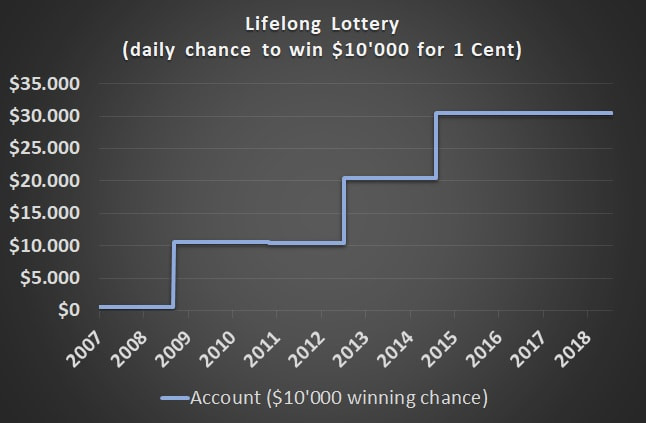
Example 1:   daily lottery prized at $10'000
Imagine someone would offer you the following lottery.
  • You have to put $500 in an account only once in your life.
  • Every day $0,01 (1 Cent) will be deducted from your account.
  • Every day you have 1:1000 chance to win $10'000.

This lottery has a minimum duration of 136 years (50'000 days). Therefore you will get a daily chance to win $10'000 on every day of your life for a single investment of only $500.
Would you accept this offer?
Picture
Picture
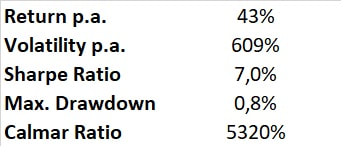
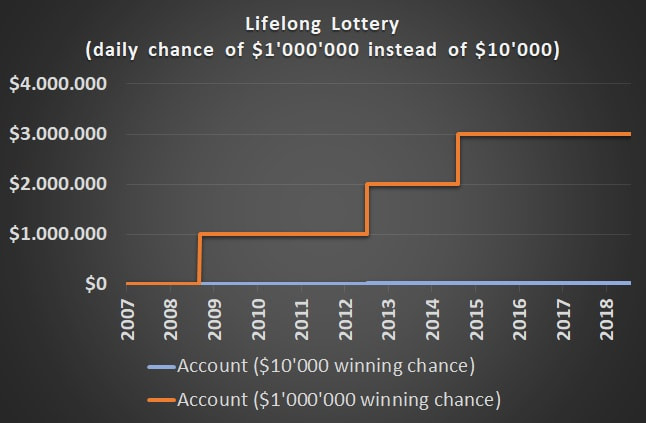
This charts illustrates how your account would have evolved during time. In regular frequency it would have increased in value by $10'000 since having a 1:1000 winning probability means that one wins every three years on average.
The metrics looks not as good as the chart, as long as you focus on volatility and sharpe ratio. During this 12 year period this strategy would have returned 43% p.a. while the volatility would have skyrocketed to 609%. Therefore the Sharpe Ratio with 7% is low compared to traditional asset classes like equity or bonds.
On the other hand, the Max. Drawdown is very low with a value of 0.8%. This leads to a sensational high Calmar Ratio of 5320% which is far beyond what traditional asset classes can deliver.

Example 2:   Who wants to be a millionaire?
Sure, the volatility looks very bad in the example above. One could criticize that this example is just designed to make the volatility look bad. On the one hand, yes this example is designed. On the other hand, all strategies with a cash flow structure comparable to an insurance product have a pay off structure like the one from the example above. The volatility punishes strategy which allow for pay offs far beyond the average return, and what makes it worse - the volatility punishes beyond average surpluses exactly the same way as it punishes losses.

The upcoming example will show once and for all that volatility is an inadequate risk measure:
Now, a new lottery is offered to you which is exactly the same as the lottery you have just seen, except one thing: instead of having a daily chance to win $10'000 now you can win $1'000'000.

  • You have to put $500 in an account only once in your life.
  • Every day $0,01 (1 Cent) will be deducted from your account.
  • Every day you have 1:1000 chance to win $1'000'000.
Picture
Picture
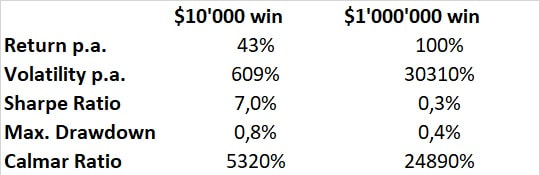
The volatility in the $1'000'000-lottery reaches a crazy 30310% compared to 609% before. The Sharpe Ratio diminishes to 0.3% from 7.0% in example 1.
An investor whose investment decisions are based on volatility and Sharpe Ratio would choose the $10'000-lottery over the $1'000'000. The Sharpe Ratio-investor does not want to be a millionaire.
It should be obvious to everyone that the right decision is to choose the $1'000'000-lottery. In contrast, the risk metric Max. Drawdown and the Calmar Ratio would lead an investor to make a reasonable decision.
Conclusion
Volatility as a risk measure is punishing deviations from a long-term average. It does not distinguish whether these deviations come from huge losses or huge profits. As a consequence all investment strategies which have an insurance-like pay-off are rated bad by the volatility.
In contrast, the Max. Drawdown is capable of measuring such strategies adequately. This is the reason, why I use the Max. Drawdown in all my strategy analysis tools to find successful systematic investment strategies.
0 Comments


Leave a Reply.

    Author

    Bertan Gueler, CFA

    Archives

    July 2019
    January 2017
    December 2015

    Categories

    All
    Alpha Strategies
    Investment Strategies
    Risk Management

    RSS Feed

Content
contact@systinvest.com
ÜBER
systinvest.com | Investmentphilosophie
BLOG
CRASH WELTKARTE
CRASH PROTECTION
Letzter Stand | Philosophie | Crashphasen Charakteristika | Beispiele Marktrisiko | Backtests
WIKIFOLIOS
RATGEBER
TOOLS
LEGENDEN
ANALYSEN
​​Altersvorsorge | Anlagestrategien | Historische Vergleiche
KRYPTO
DISCLAIMER
DATENSCHUTZERKLÄRUNG
IMPRESSUM
Content
ABOUT
systinvest.com | Investment Philosophy
BLOG
CRASH WORLD MAP
CRASH PROTECTION
Latest Status | Philosophy | Crashperiod Characteristics | Examples Market Risk | Backtests
WIKIFOLIOS
GOOD TO KNOW
TOOLS
ANALYSES
Pension | Investment Strategies |Historical Backtests
CRYPTO
DISCLAIMER
DATENSCHUTZERKLÄRUNG
IMPRESSUM
  • Über
    • über Systinvest
    • Investmentphilosophie
  • Blog
  • Crash Weltkarte
  • Crash Protection
    • Letzter Stand
    • Philosophie
    • Crashphasen Charakteristika
    • Beispiele Marktrisiko
    • Backtests Crash Protection
  • wikifolios
    • Hebel +3faches Risikomanagement
    • Hebel Multistrategien
    • Marktzyklen offensiv gehebelt
    • Marktzyklen
    • Aktienwertselektion mit System
    • Alpha+Beta+Crash Risk Control
  • Ratgeber
    • Wie teuer sollte ein ETF oder Fonds sein?
    • Kann man mit Aktien reich werden?
    • Wie kann man sich vor Inflation schützen?
    • Crash am Aktienmarkt - Wieviel kann man verlieren?
    • Wie riskant sind Aktiensparpläne wirklich?
  • Tools
    • Sparplanrechner
    • Annuitätenrechner
  • Legenden
    • Warren Buffet
    • Edward O. Thorp
    • James Simons
    • "Pitbull" Marty Schwartz
    • Stanley Druckenmiller
  • Analysen
    • Altersvorsorge >
      • Inflation und Kaufkraftverlust
      • Inflationsschutz - Aktien oder Gold?
      • Generationen Altersvorsorge
      • Sparplanvergleich Aktien/Lebensversicherung >
        • Berechnungsannahmen
        • Ohne Steuerbetrachtung
        • Effekt Abgeltungssteuer
        • Effekt Inflation
    • Anlagestrategien >
      • Vola und Sharpe Ratio
      • Aktien mit Vola 2%
      • Momentum
    • Historische Vergleiche >
      • DAX 2016
      • DAX vs S&P 500
  • About
    • About systinvest
    • Investment philosophy
  • Blog
  • Crash World Map
  • Crash Protection
    • Latest Status
    • Philosophy
    • Crashperiod Characteristics
    • Examples Market Risk
    • Backtest Crash Protection
  • wikifolios
    • Leverage +3x Risk Management
    • Leverage Multistrategies
    • Marketcycles leveraged dynamically
    • Marketcycles
    • Systematic Stockpicking
    • Alpha + Beta + Crash Risk Control
  • Good to Know
    • How much should a fund cost?
    • Can you get rich with stocks?
    • How to protect against inflation?
    • Stock Market Crashs - How much can you lose?
    • Are stock saving plans really risky?
  • Tools
    • Savings Plan Calculator
    • Annuity Calculator
  • Analyses
    • Pension >
      • Inflation and Purchasing Power
      • Inflation protection - Stocks or Gold?
      • Cross-Generational Pension Plan
    • Investment Strategies >
      • Vola and Sharpe Ratio
      • Equity with 2% Vola
      • Momentum-en
    • Historical Backtests >
      • DAX 2016-en
      • S&P 500 vs DAX