Breakout Check - by Country
Breakout Check - Country Ranking (per 1 million citizen)
Countries to the left are the ones with the highest weekly infection increases. The blue columns show the number of total infections per 1 million citizen while the yellow triangles show the weekly increase.
Countries to the left are the ones with the highest weekly infection increases. The blue columns show the number of total infections per 1 million citizen while the yellow triangles show the weekly increase.
Breakout Check - Weekly Changes by Country in a direct comparison
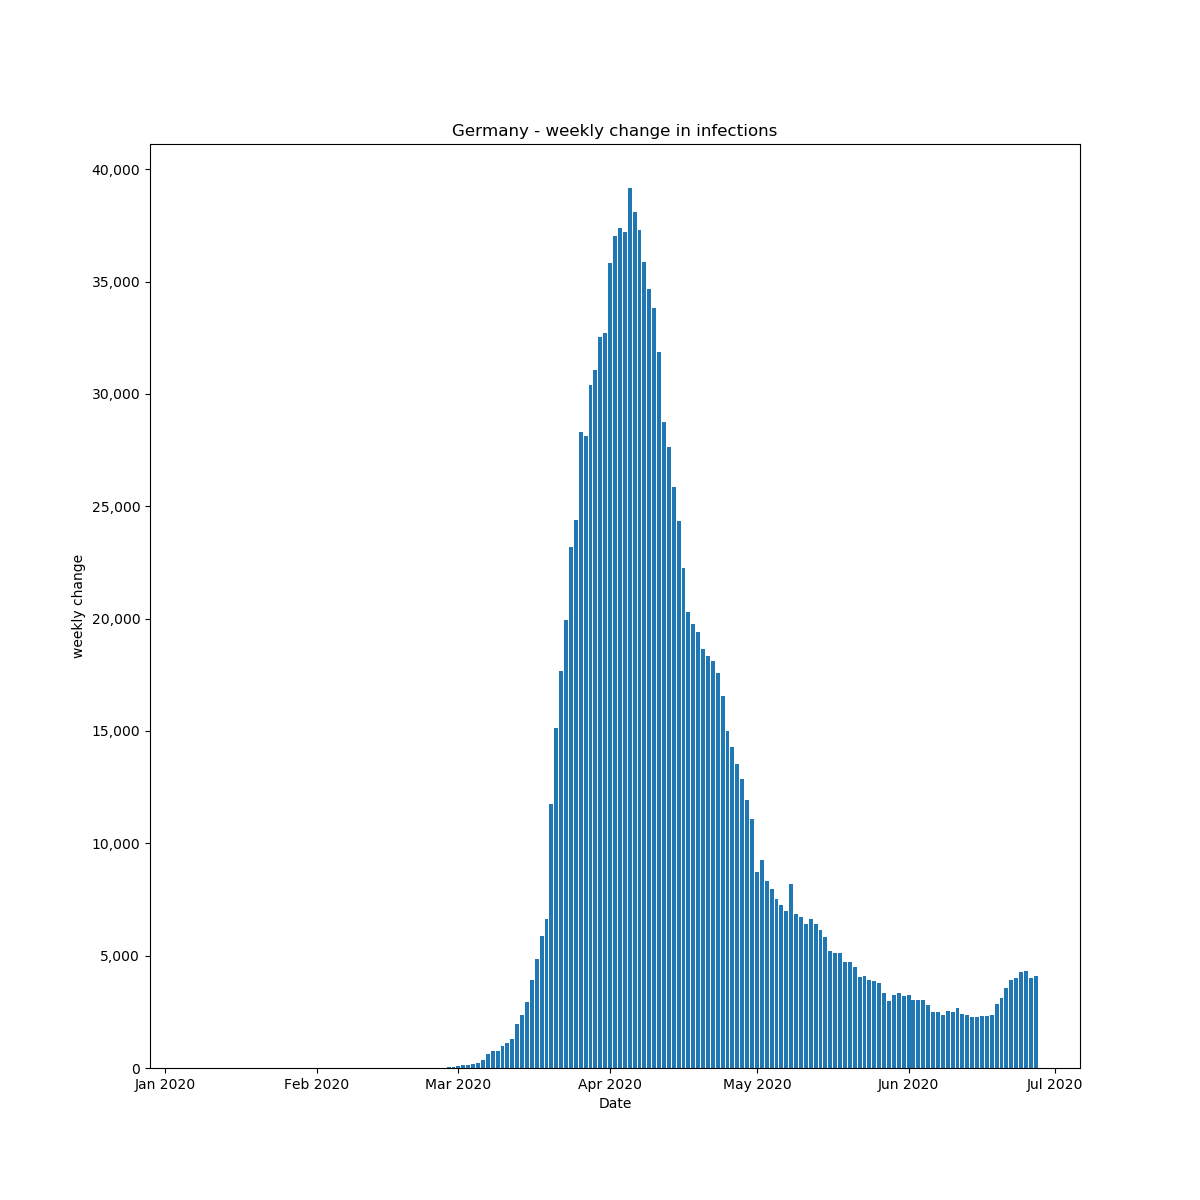
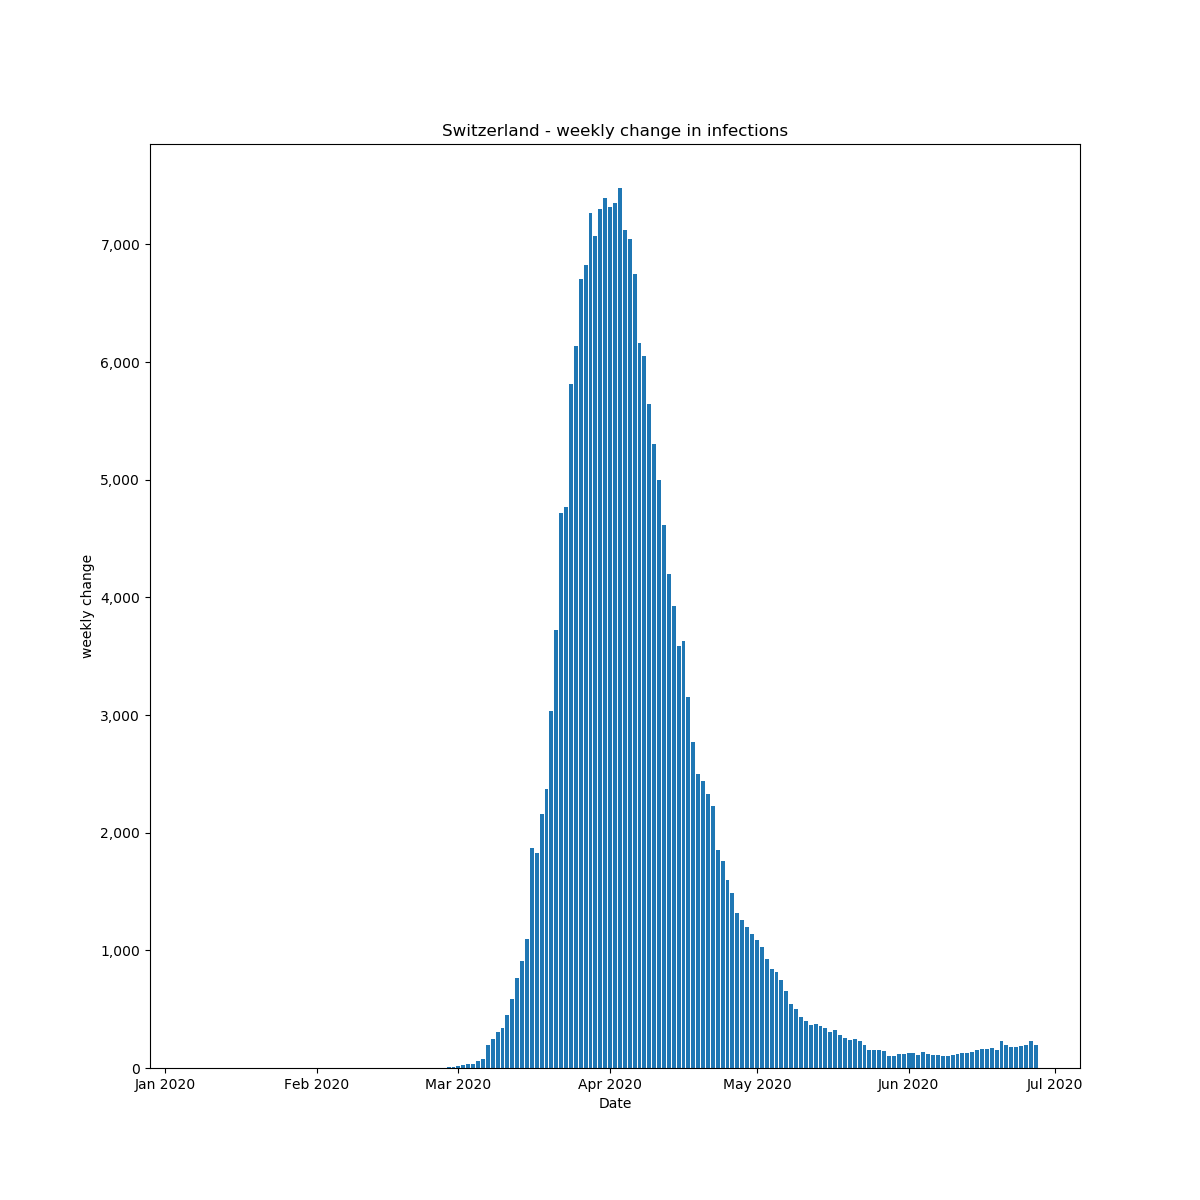
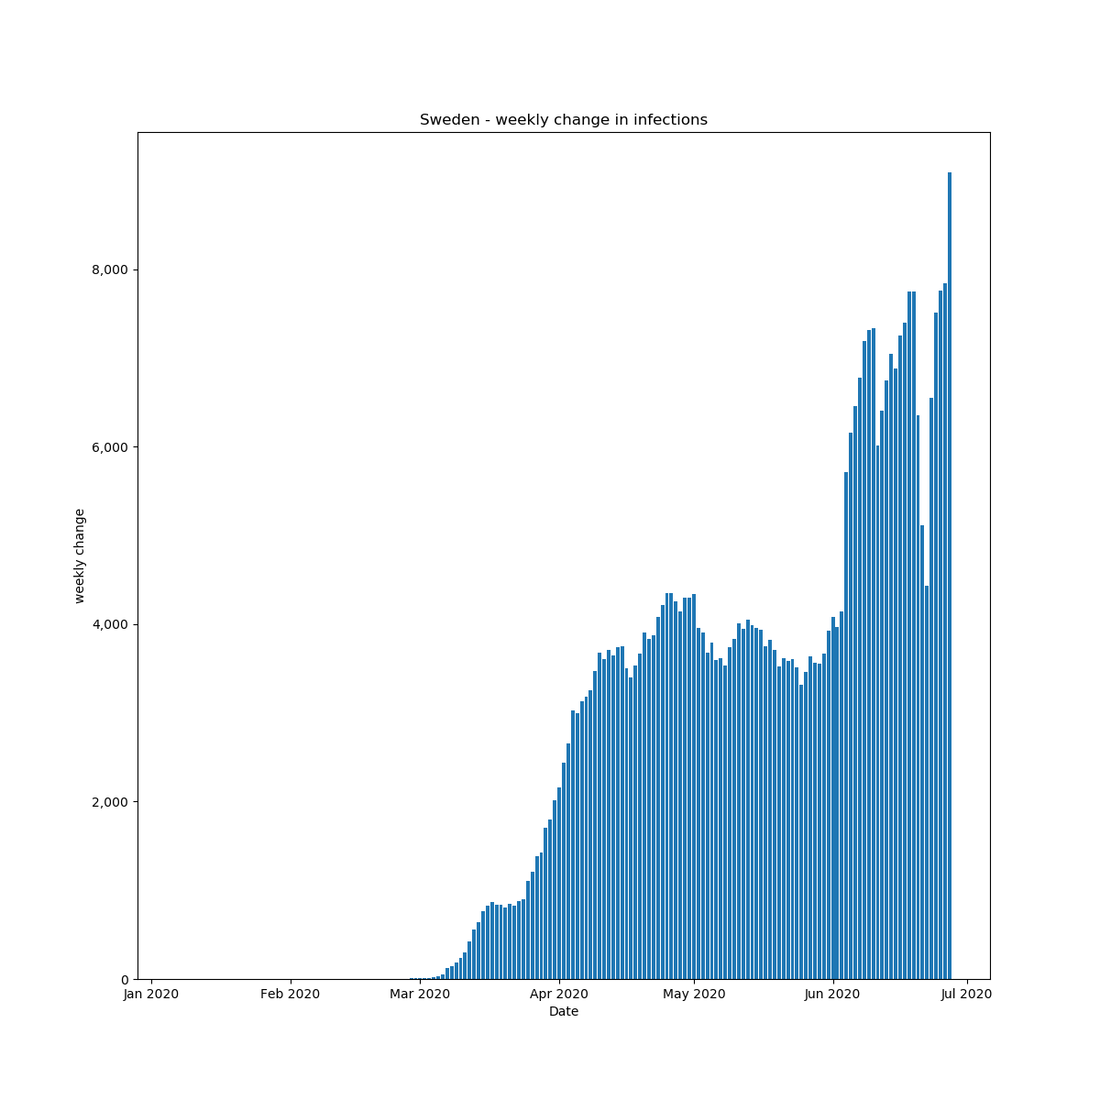
This overview should help to detect countries in which a second wave might break out recently. Corona-free would mean, that the column charts would drop to zero at the right end. Increases to the right means an increasing number of new corona infections. The quicker this rise, the bigger the risk for a severe wave of infections.
This overview should help to detect countries in which a second wave might break out recently. Corona-free would mean, that the column charts would drop to zero at the right end. Increases to the right means an increasing number of new corona infections. The quicker this rise, the bigger the risk for a severe wave of infections.
|
|
|
|
|
|
|
|
|
|
|
|
|
|
|
|
|
|
|
|
|
|
|
|
|
|
|
|


